Price is the most unpredictable variable that can surprise many with its bursts, reversals, figures and pirouettes. Despite the fact that there are a huge number of stories of earnings based on intuition, all of them logically end after some time in the same thing: the loss of the deposit.
Actually, the currency market and adrenaline are two incompatible things. Only curbed emotions and a systemic approach can bring stability to trade. This cannot be achieved without understanding the market, the ability to predict it and use these skills in your trading strategy. A trading plan and a clear algorithm of actions is what every trader should start with. Forex indicators and technical analysis can help you along the way. They will be discussed in this article.
What are Indicators and Why a Trader Needs Them
Indicators are the foundation around which technical analysis of charts is built. In fact, these are computer programs that transform the price, changing its appearance based on mathematical formulas, and help the trader to correctly predict the upcoming market movement.
The brokerage company NordFX provides its clients with the MetaTrader4 (MT4) platform, which has already proven itself in the financial markets, with a huge number of various indicators that can be compared to a lifesaver. Can I do without it? In theory yes, but why? After all, Forex indicators solve a huge number of tasks, and you get them for free.
So, what they do:
- Help with markup;
- Generate signals for opening and closing trades;
- Demonstrate a real market trend, not an accumulation of incomprehensible noise;
- Simplify computing processes and display the information you need (spread size, lot, commission, time, sessions);
- Allow you to create your trading strategy;
- Make the trade process easier and clearer;
- Become the basis for the creation of robot advisors, which are able to trade tirelessly instead of a trader 24 hours a day;
- Determine the necessary characteristics of the price (rate of change, volatility, extremes, direction, angle, strength of movement, volume);
- Allow you to find unique patterns and historical coincidences.
In fact, any indicator for trading is in its own way a unique mechanism that allows you to bring common sense, logic, and system into the process of making transactions. Moreover, indicators are one of the few tools that even beginners can use without any trading experience.
An important characteristic that applies to all indicators is their versatility. This means that any currency pair is suitable for trading using technical analysis - EUR/USD, GBP/USD, USD/CHF, USD/JPY, EUR/GBP and many others. The Forex trading chart can also be built on any time frame - from one minute to one month. In addition to currency pairs, you can analyze the behavior of many other trading instruments that NordFX offers you: cryptocurrencies, oil, precious metals, stocks, and stock indices. This whole array is predictable by means of indicators. The only thing that will need to be changed is their parameter settings.
As it has already been said, indicators can solve a huge number of tasks that traders assign to them. Standard forex indicators are mainly taken from classical literature on technical analysis or developed by eminent exchange gurus. They are time-tested, have received well-deserved recognition, and therefore are integrated by default into most trading platforms.
There is a second group of indicators for trading in Forex and other markets, the so-called custom indicators. There are many thousands of them on the Internet, and usually traders create them for their specific needs. They are not necessarily based on a unique algorithm. On the contrary, very often they represent a modified version of a standard indicator. For example, in order to improve the information content, the graphics are changed, sound signals or other forms of notification are added (for example, some indicators are able to send notifications by e-mail or directly to your phone). In fact, it is quite difficult to come across fundamentally new custom indicators that will also be really useful in trading. And beginners can sometimes become victims of scammers who sell a standard indicator online, slightly changing its functionality, inventing a new loud name for it and praising it as a miracle that can make a buyer rich in an instant.
Types of Trade Indicators
Depending on the goals and features, indicators on Forex are usually divided into the following types:
- Trend;
- Oscillators;
- Volumes;
- Predictive;
- Assistants;
Trend Indicators
The main task that the trader must solve before opening trades is to determine the general direction of the price movement. It is also called a trend in books on technical analysis. The problem is that market noise in the form of a series of small spikes, pullbacks, and stumbling blocks prevents you from doing so. It can be cut off by any indicator from this global group.
Trend indicators allow you to solve the following problems:
- Determine the global direction of the trend and set the general direction of opening transactions during trading;
- Fix a change in market sentiment, a change in trend;
- Find a signal to open a trade;
- Perform the function of a signaling tool in a trading strategy.
It is important to note that for the most part, the basic algorithm of trend indicators operation is averaging, or smoothing, of the price chart. Its different forms, types and even unique formulas can be used. However, in order to isolate the noise, it is necessary to globally average the data, which, in turn, causes signal delays. Moreover, the smoother the chart we get, the greater this delay will be.
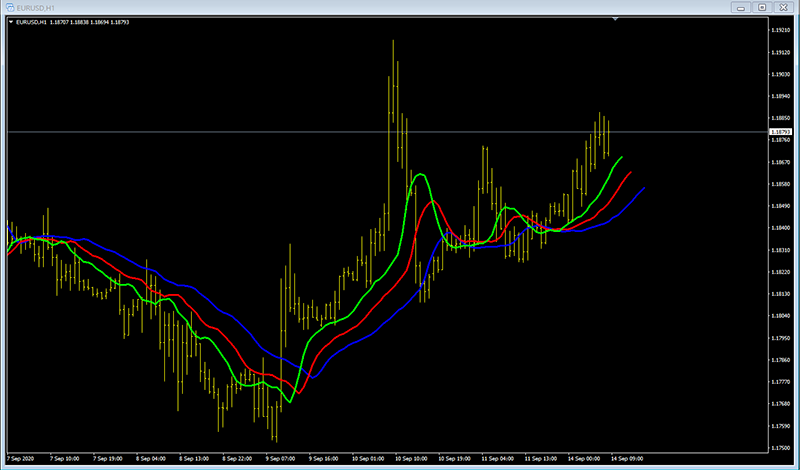
Among the most famous indicators for trading in the foreign exchange market, we can note the following: Moving Average (moving averages), Alligator (Fig. 1), Bollinger Bands. ADX; Parabolic SAR, Ichimoku Kinko Hyo.
Oscillators
Many newcomers have difficulty opening deals, namely formulating clear and understandable criteria for this action. In fact, you can use an oscillator to find the entry point, which is the name of the place on the chart where you open your trade.
An oscillator is a technical analysis indicator that, unlike trend instruments, does not show the global price direction, but the current market situation. Typically, it is a particular currency or other trading instrument being overbought or oversold. That is, the oscillator shows the moments when the market reaches its limit in any direction, and the probability of a correction or a complete reversal of the trend is approaching its maximum values.
Oscillators are capable of generating huge amounts of trading signals. Their main problem is that there is no trend as such for them. They compare ranges of the immediate past to the current market. As a result, at the moment when the price begins to move in one direction for a long time, and Forex charts update one high/low after another, they can give a lot of false signals. And it does not matter which oscillator you take - false signals are not avoided unless you use other trading indicators, such as trend ones, as additional filters.
You will find a fairly large number of various oscillators for Forex trading in the MetaTrader-4 trading terminal, which the broker NordFX provides to its clients. We strongly recommend paying attention to the following: RSI, Momentum, Stochastic, Force Index, ATR, Williams' Percent Range.
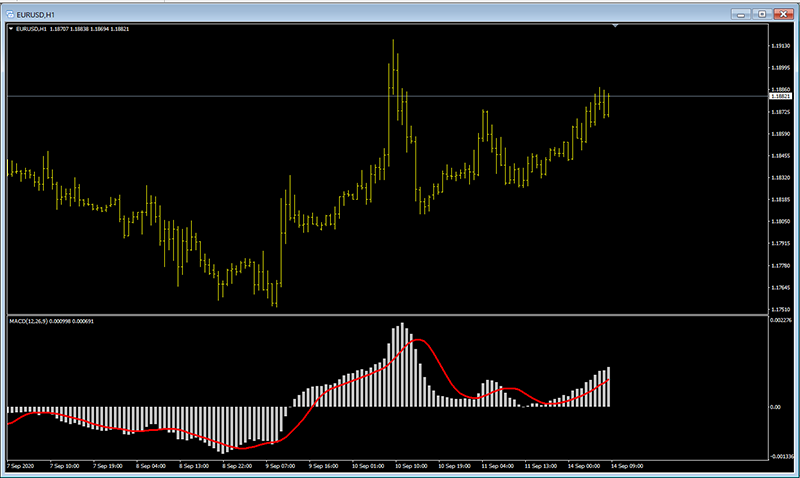
The indicator known as MACD (Moving Average Convergence / Divergence) is very popular among traders, which, due to its versatility, works both as a trend indicator and as an oscillator. The MACD (Figure 2), developed by Gerald Appel in the 1970s, shows the distance between moving averages, allowing you to determine the direction, strength and dynamics of price changes, and has been successfully used in many trading systems to predict the points of entry and exit from a trade.
Volume Indicators
Many beginners often do not understand why the Forex chart is moving, and most importantly, who is behind such a movement. Understanding comes when you start to study who runs the show - the big loners with big money or the crowd.
The price is also called a mirror that reflects the fears and expectations of the vast majority of bidders. Any movement of quotes occurs only because someone bought or sold the asset at that moment. That is why, studying the volumes, it is possible to understand whether there is a real fuel of money at the price movement, or, on the contrary, it arose because of the small number of active participants.
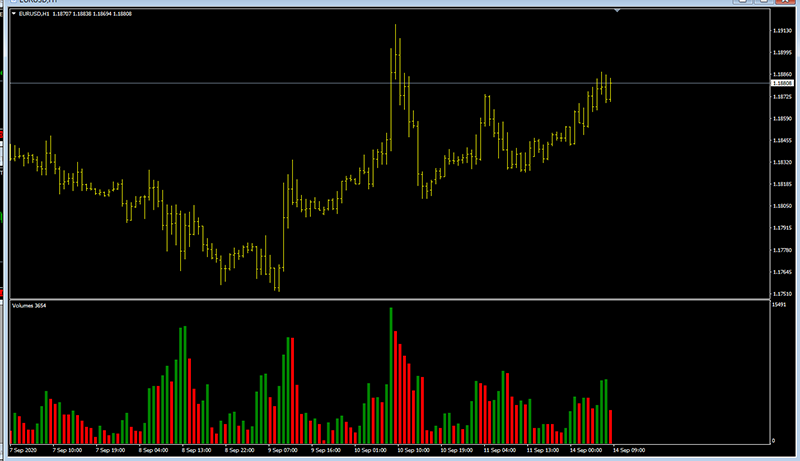
The problem is that Forex is an over-the-counter market. Due to the fact that there is no single control center, it is impossible to find out the real amounts of money that are currently circulating in the market. However, volume indicators were invented in order to somehow measure the activity of big players. In the MT4 terminal, which is available to all NordFX clients, you can use the following developments: Volumes (Fig. 3), Accumulation/Distribution, Money Flow Index, On Balance Volume.
Despite the fact that all indicators from this group of instruments are fairly criticised, a separate direction of analysis has emerged on the foreign exchange market based on them - VSA (Volume Spread Analysis) . Moreover, Forex traders have started to create their own modifications, which greatly expanded the possibilities of their use. Useful functions of volume indicators are as follows:
- Allow you to identify large players;
- Give the opportunity to assess the prospects of momentum and catch its beginning;
- Cut off signals of other indicators, patterns, candle models behind which there is no real money supply.
By itself, this group of tools is rarely used to find an entry point. However, if you see the imbalance of forces in a certain direction, you can understand what plan you need to act on.
Predictive Indicators
One of the main desires of novice traders is to shift the load of responsibility from themselves to someone else. Scammers, swindlers and enterprising programmers have felt this perfectly. Therefore, a special type of indicators has emerged - predictive.
They, like a psychic, show where the market will go, moreover, they draw at what level the price will be in the future. The problem is that in most cases these are commercial products, the purpose of which is to sell them as expensive as possible to naive beginners.
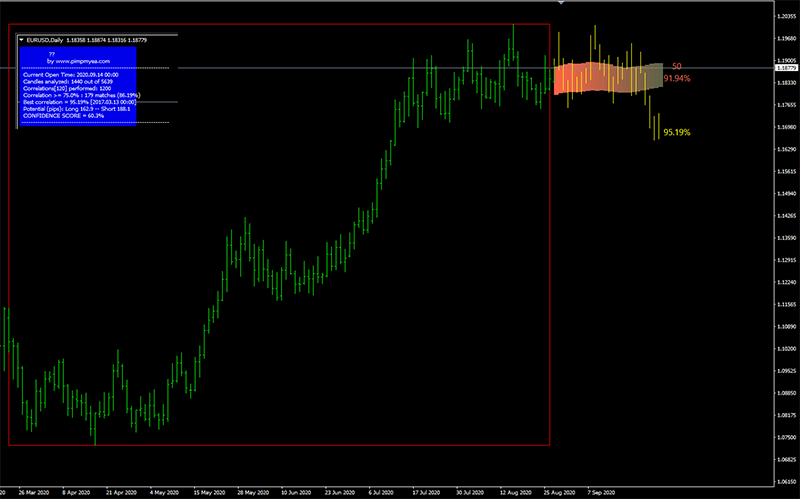
Still, something sensible can be found among them. For example, FuturoFX (Fig.4) and WMiFor use Spearman Rank Correlation. In simple terms, they find matches on the history of how the price behaves at the moment. If there are several identical scenarios for the development of an event, the future and the probability as a percentage of its development are drawn. A kind of special approach to statistics.
Assistants
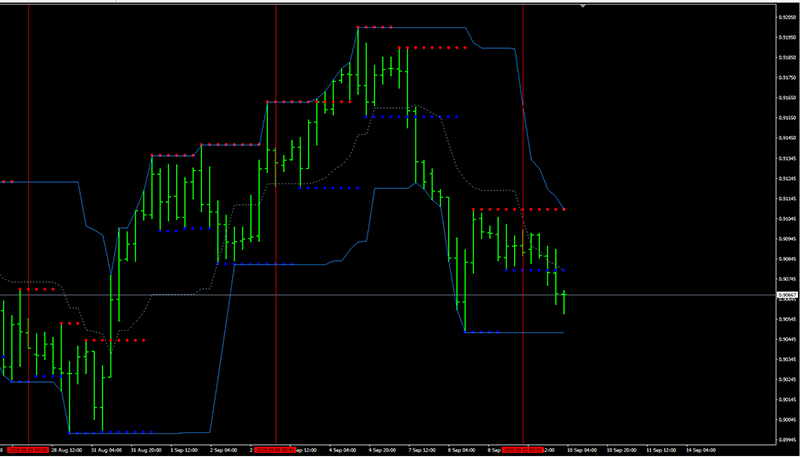
Assistants (Figure 5) is a huge group of Forex indicators, one of the most numerous and really useful. They do not impose advice on the trader on how to act, but only help them with typical tasks that they may face in the trading process. So that you understand the full depth of the options for their use, we suggest that you get acquainted with the functions that they most often perform:
- Make the markup of support and resistance levels;
- Provide secondary information on the account: balance, drawdown, spread, swap, data on open position and the like;
- Apply horizontal levels, channels, trend lines and extremes;
- Line up graphic figures: triangle, flag, head and shoulders, and so on;
- Find candle models and patterns;
- Act as a calculator, giving recommendations on lot, risk and money management.
- Show the boundaries of trading sessions.
Each can make market visualization convenient, simple and understandable. We can recommend them to those traders who are just starting to study graphical and candlestick analysis.
What to Do if You Don't Have the Right Indicator
Undoubtedly, as your professional skill grows, you may have new ideas, theories and strategies that you would like to translate into reality. In fact, it is not difficult at the moment. To do this, you can go one of two ways. The first is to start learning programming and creating all the indicators yourself. The second is to limit yourself to writing the algorithm, and based on it, order an indicator from a programmer.
Don't think that coding services are expensive. A simple indicator will be created for you for $20-50 at freelance exchanges, and if you look for like-minded people, it is quite likely to get a code for free in exchange for your algorithm.
By the way, if you can't immediately find something among the custom indicators, put out a call at specialized forums. A huge number of people are faced with similar difficulties and they will most likely help you find exactly what you are looking for.
Pros and Cons of Using Indicators
Forex indicators are a great way out for a novice trader who does not know which way to approach the analysis and forecasting of markets. However, they also have weaknesses:
- Redrawing and signal lag;
- Lack of accounting for fundamental data (news, economic statistics, hot political events);
- Binding to stationary platforms in case of using custom indicators;
There are, however, much more advantages:
- Easy to use;
- Clear visual form of signals;
- Simplify the markup process and save time
- They are universal and can be used to trade almost any currency pair and other assets;
- Amenable to customization and optimization;
- Easily amenable to programming and become part of a trading advisor;
- They are the basis for creating a trading strategy;
Summing up, we would like to warn you that an indicator is not a panacea, but just a tool with which you conduct market analysis and make certain decisions. So, the final word will always be yours. And it depends on you how successful your trading in the financial markets will be.
திரும்பிச் செல்லவும் திரும்பிச் செல்லவும்
