தொழில்நுட்ப பகுப்பாய்வு கான்சொலிடேஷனை, விலை ஒரு தெளிவான ஏறுநிலை அல்லது இறங்குநிலையை உருவாக்காமல், ஒப்பீட்டளவில் குறுகிய வரம்பிற்குள் பக்கவாட்டாக நகரும் ஒரு காலகட்டமாக வரையறுக்கிறது. இந்த கட்டத்தில், வாங்கும் மற்றும் விற்கும் அழுத்தம் ஏறத்தாழ சமநிலையில் இருப்பதால், விலை பெரும்பாலும் ஆதரவு மற்றும் எதிர்ப்பு மட்டங்களுக்கு இடையில் ஊசலாடுகிறது. கான்சொலிடேஷன் பொதுவாக ஒரு பலமான நகர்வுக்குப் பிறகு தோன்றுகிறது, அப்போது சந்தை தனது அடுத்த திசையை தீர்மானிக்கும் முன் ஒரு இடைவெளியை எடுக்கிறது. இந்த மண்டலங்களை வர்த்தகர்கள் கவனமாக கண்காணிக்கின்றனர், ஏனெனில் கான்சொலிடேஷன் பெரும்பாலும் ஒரு பிரேக்அவுட்டுக்கு வழிவகுக்கும், இது ஒரு புதிய போக்கைத் தொடங்கக்கூடும்.
கான்சொலிடேஷன் என்றால் என்ன
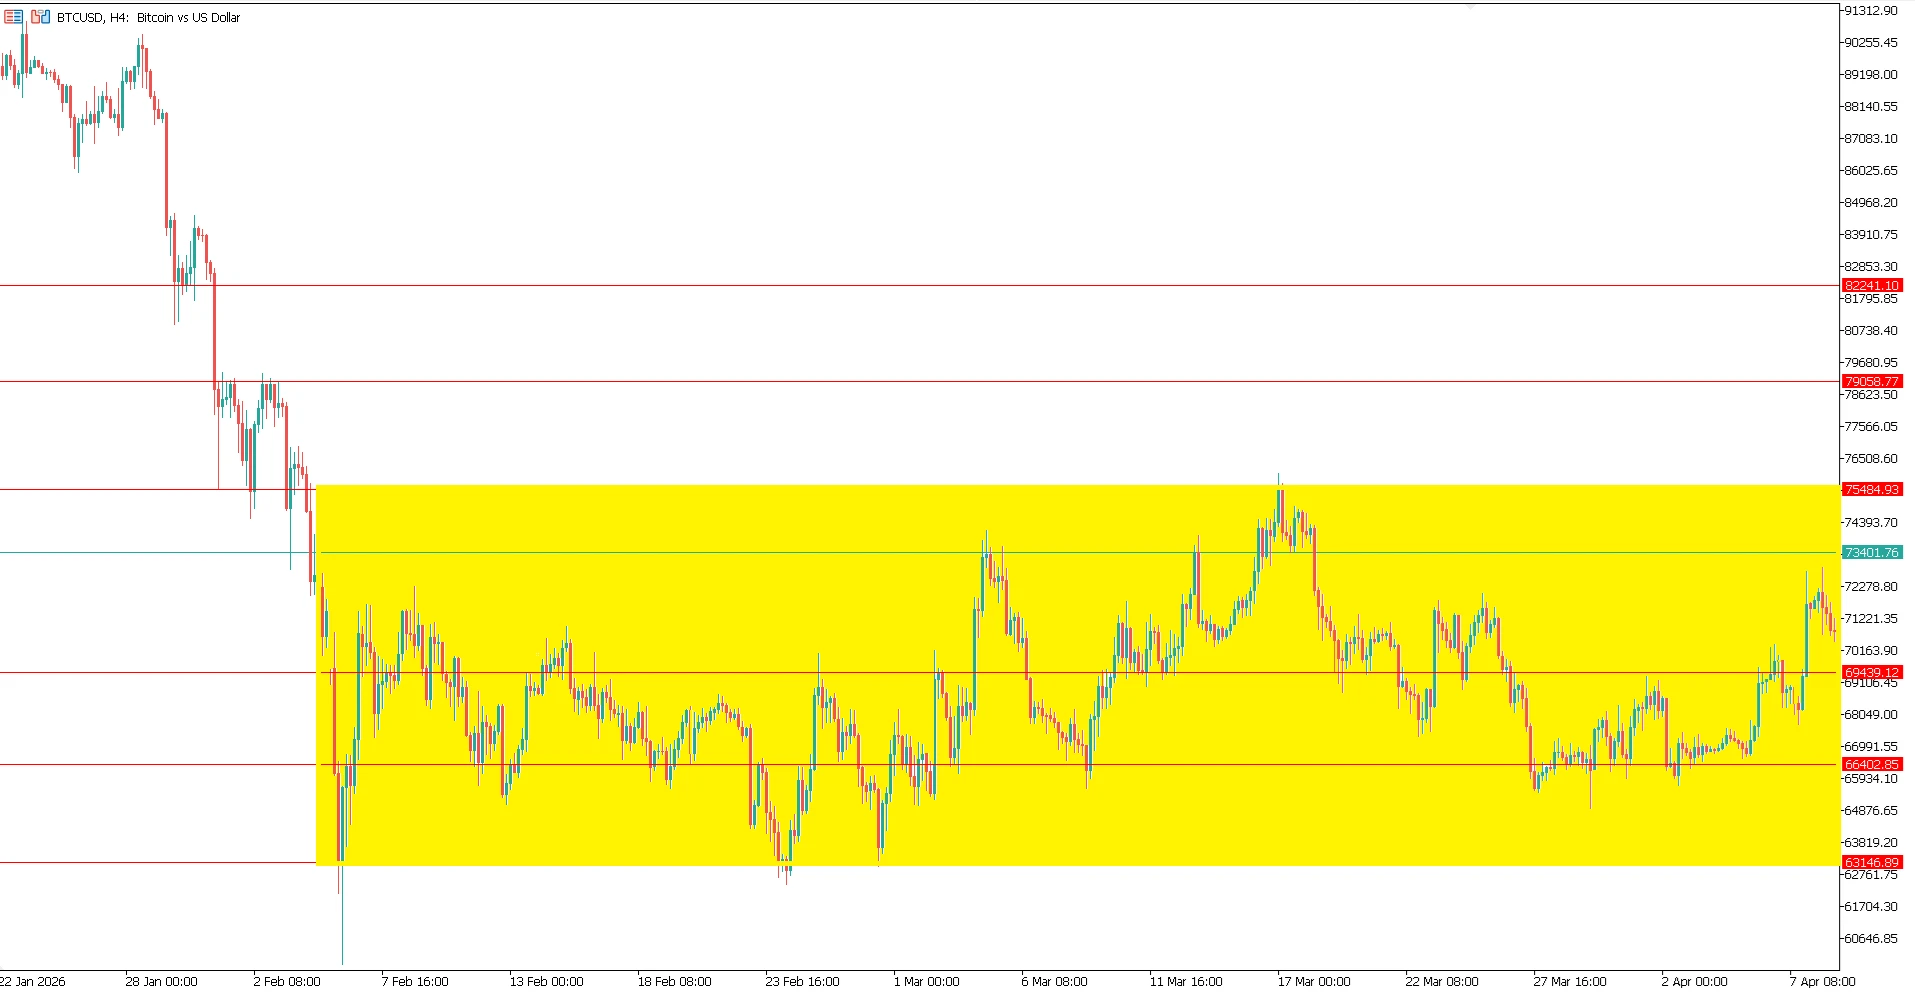
கான்சொலிடேஷன் என்பது சந்தையின் ஒரு இடைவெளியாகும். விலை பலமான திசைசார் முன்னேற்றத்தை நிறுத்தி, ஒரு வரம்பிற்குள் வர்த்தகம் செய்யத் தொடங்குகிறது.
இது ஒரு தூண்டுதல் நகர்வுக்குப் பிறகு, நிச்சயமற்ற தன்மையின் போது, அல்லது சந்தை புதிய தகவலுக்காக காத்திருக்கும்போது நிகழக்கூடும். இதன் விளைவாக பெரும்பாலும் சிறிய கேண்டில்களுடன் தட்டையான அல்லது சுருக்கமான விலை அமைப்பும், குறைந்த நிலையற்ற தன்மையும் ஏற்படுகிறது. கான்சொலிடேஷன் என்பது வரம்புக்குட்பட்ட சந்தை, பக்கவாட்டு நகர்வு அல்லது ஒரு அடித்தளம் என்றும் விவரிக்கப்படுகிறது.
கான்சொலிடேஷன் ஏன் முக்கியமானது
கான்சொலிடேஷன் முக்கியமானது, ஏனெனில் இது பெரும்பாலும் ஒரு பெரிய நகர்வுக்கு முன்பே நிகழ்கிறது.
ஒரு நீண்ட வரம்பு ஒரு சுருட்டப்பட்ட ஸ்பிரிங்கைப் போல செயல்படக்கூடும்: விலை எவ்வளவு நீண்ட நேரம் சுருக்கப்படுகிறதோ, அவ்வளவு அதிக கவனத்தை வர்த்தகர்கள் இறுதி பிரேக்அவுட்டில் செலுத்துவார்கள். ஆதரவு மற்றும் எதிர்ப்பு மட்டங்கள் தெளிவாகத் தெரிவதால், கான்சொலிடேஷன் வர்த்தகர்களுக்கு இடர் நிலையை மிகத் தெளிவாக வரையறுக்க உதவும். ஆரம்பநிலையாளர்களுக்கு, இது படிக்க எளிதான விளக்கப்பட நிலைமைகளில் ஒன்றாக இதை ஆக்குகிறது.
முக்கிய பண்புகள்
- விலை ஆதரவு மற்றும் எதிர்ப்புக்கு இடையில் நிலைத்திருக்கும்.
- நிலையற்ற தன்மை பொதுவாக போக்குகளின் போது இருப்பதைவிடக் குறைவாக இருக்கும்.
- கேண்டில்ஸ்டிக்குகள் பெரும்பாலும் சிறியதாகவும் திசைசாராததாகவும் மாறும்.
- சந்தை காத்திருக்கும்போது வர்த்தக அளவு குறையக்கூடும்.
- உயர்ந்த உச்சங்கள் அல்லது தாழ்ந்த கீழ்நிலைகளின் தொடர்ச்சி எதுவும் விளக்கப்படத்தில் ஆதிக்கம் செலுத்துவதில்லை.
சந்தை கட்டங்களின் ஒப்பீடு
சந்தை கட்டம் | விலை நடத்தை | நிலையற்ற தன்மை | வர்த்தகர் கவனம் |
கான்சொலிடேஷன் | ஒரு வரம்பிற்குள் பக்கவாட்டாக நகர்கிறது | குறைவு | ஆதரவு, எதிர்ப்பு, பிரேக்அவுட் அமைப்பு |
ஏறுநிலை போக்கு | உயர்ந்த உச்சங்களையும் உயர்ந்த கீழ்நிலைகளையும் உருவாக்குகிறது | மிதமான முதல் அதிகம் வரை | போக்கு தொடர்ச்சி, பின்வாங்கல்கள் |
இறங்குநிலை போக்கு | தாழ்ந்த உச்சங்களையும் தாழ்ந்த கீழ்நிலைகளையும் உருவாக்குகிறது | மிதமான முதல் அதிகம் வரை | ஷார்ட் அமைப்புகள், எதிர்ப்பு தோல்விகள் |
கான்சொலிடேஷன் என்பது போக்கு கட்டங்களுக்கு இடையிலான நடுநிலை நிலையாகும், அதனால்தான் இது பெரும்பாலும் ஒரு மாறுதல் மண்டலமாக செயல்படுகிறது.
கான்சொலிடேஷனை எவ்வாறு கண்டறிவது
ஒரே விலை மட்டங்களில் மீண்டும் மீண்டும் நிகழும் எதிர்வினைகளைக் கவனியுங்கள். விலை இரண்டு கிடைமட்ட எல்லைகளுக்கு இடையில் தொடர்ந்து குதித்துக் கொண்டிருந்தால், சந்தை கான்சொலிடேட் செய்யக்கூடும்.
மற்ற அறிகுறிகள்:
- குறுகிவரும் பொலிங்கர் பேண்ட்ஸ்.
- தட்டையாகும் நகரும் சராசரிகள்.
- ஒன்றுடன் ஒன்று மேற்பொருந்தும் உடல்களுடன் சிறிய கேண்டில்கள்.
- பலவீனமான மொமன்டம் இண்டிகேட்டர்கள்.
- தெளிவான போக்கு அமைப்பின் பற்றாக்குறை.
ஒரு எளிய விதி இதுதான்: விளக்கப்படம் திசைசார் உச்சங்கள் மற்றும் கீழ்நிலைகளின் தொடரை உருவாக்குவதை நிறுத்தினால், கான்சொலிடேஷன் உருவாகி இருக்கலாம்.
பொதுவான கான்சொலிடேஷன் வடிவங்கள்
- செவ்வகம். விலை தட்டையான ஆதரவு மற்றும் எதிர்ப்புக்கு இடையில் நகர்கிறது.
- முக்கோணம். உச்சங்கள் அல்லது கீழ்நிலைகள் நெருக்கமாக வரும்போது விலை சுருங்குகிறது.
- ஃபிளாக். ஒரு பலமான நகர்வுக்குப் பிறகு ஒரு குறுகிய இடைவெளி.
- பென்னன்ட். தொடர்ச்சிக்கு முன் ஒரு சிறிய சமச்சீர் இடைவெளி.
இந்த வடிவங்கள் முக்கியமானவை, ஏனெனில் அவை பெரும்பாலும் பிரேக்அவுட்டுகளுக்கு வழிவகுக்கும், குறிப்பாக பலமான மொமன்டத்திற்குப் பிறகு அவை தோன்றும்போது.
வர்த்தகர்கள் இதை எவ்வாறு பயன்படுத்துகிறார்கள்
வர்த்தகர்கள் பொதுவாக கான்சொலிடேஷனை மூன்று வழிகளில் ஒன்றில் அணுகுகின்றனர்.
- வரம்பு வர்த்தகம். ஆதரவுக்கு அருகில் வாங்கி, எதிர்ப்புக்கு அருகில் விற்கவும்.
- பிரேக்அவுட் வர்த்தகம். விலை வரம்புக்கு வெளியே மூடும்போது நுழையவும்.
- காத்திருந்து பார். சந்தை திசையைக் காட்டும் வரை வர்த்தகத்தைத் தவிர்க்கவும்.
வரம்பு தெளிவாகவும் நிலையானதாகவும் இருக்கும்போது வரம்பு வர்த்தகம் சிறப்பாக செயல்படுகிறது. பிரேக்அவுட் பலமான கேண்டில்கள், வர்த்தக அளவு அல்லது மொமன்டம் மூலம் உறுதிப்படுத்தப்படும்போது பிரேக்அவுட் வர்த்தகம் சிறப்பாக செயல்படுகிறது.
இடர்கள் மற்றும் தவறுகள்
கான்சொலிடேஷன் பயனுள்ளதாக இருந்தாலும், ஆரம்பநிலையாளர்கள் பெரும்பாலும் இதை தவறாகப் புரிந்துகொள்கிறார்கள்.
- தவறான பிரேக்அவுட்டுகள். விலை வரம்பிலிருந்து வெளியேறி விரைவாகத் திரும்புகிறது.
- தவறான நேரம். உறுதிப்படுத்தலுக்கு முன் நுழைவது இழப்புகளுக்கு வழிவகுக்கும்.
- சூழலை புறக்கணிப்பது. ஒரு ஏறுநிலை போக்குக்குப் பிறகு நிகழும் கான்சொலிடேஷன், தலைகீழாதலுக்கு அல்ல, தொடர்ச்சிக்கு முந்தைய ஒரு இடைவெளியாக இருக்கலாம்.
- இறுக்கமான ஸ்டாப்கள். குறுகிய வரம்புகள் முன்கூட்டிய ஸ்டாப்-அவுட்களைத் தூண்டக்கூடும்.
ஒவ்வொரு பிரேக்அவுட்டும் உண்மையானது என்று கருதுவதற்குப் பதிலாக உறுதிப்படுத்தலுக்காக காத்திருப்பதே பாதுகாப்பான பழக்கமாகும்.
நடைமுறை உதாரணம்
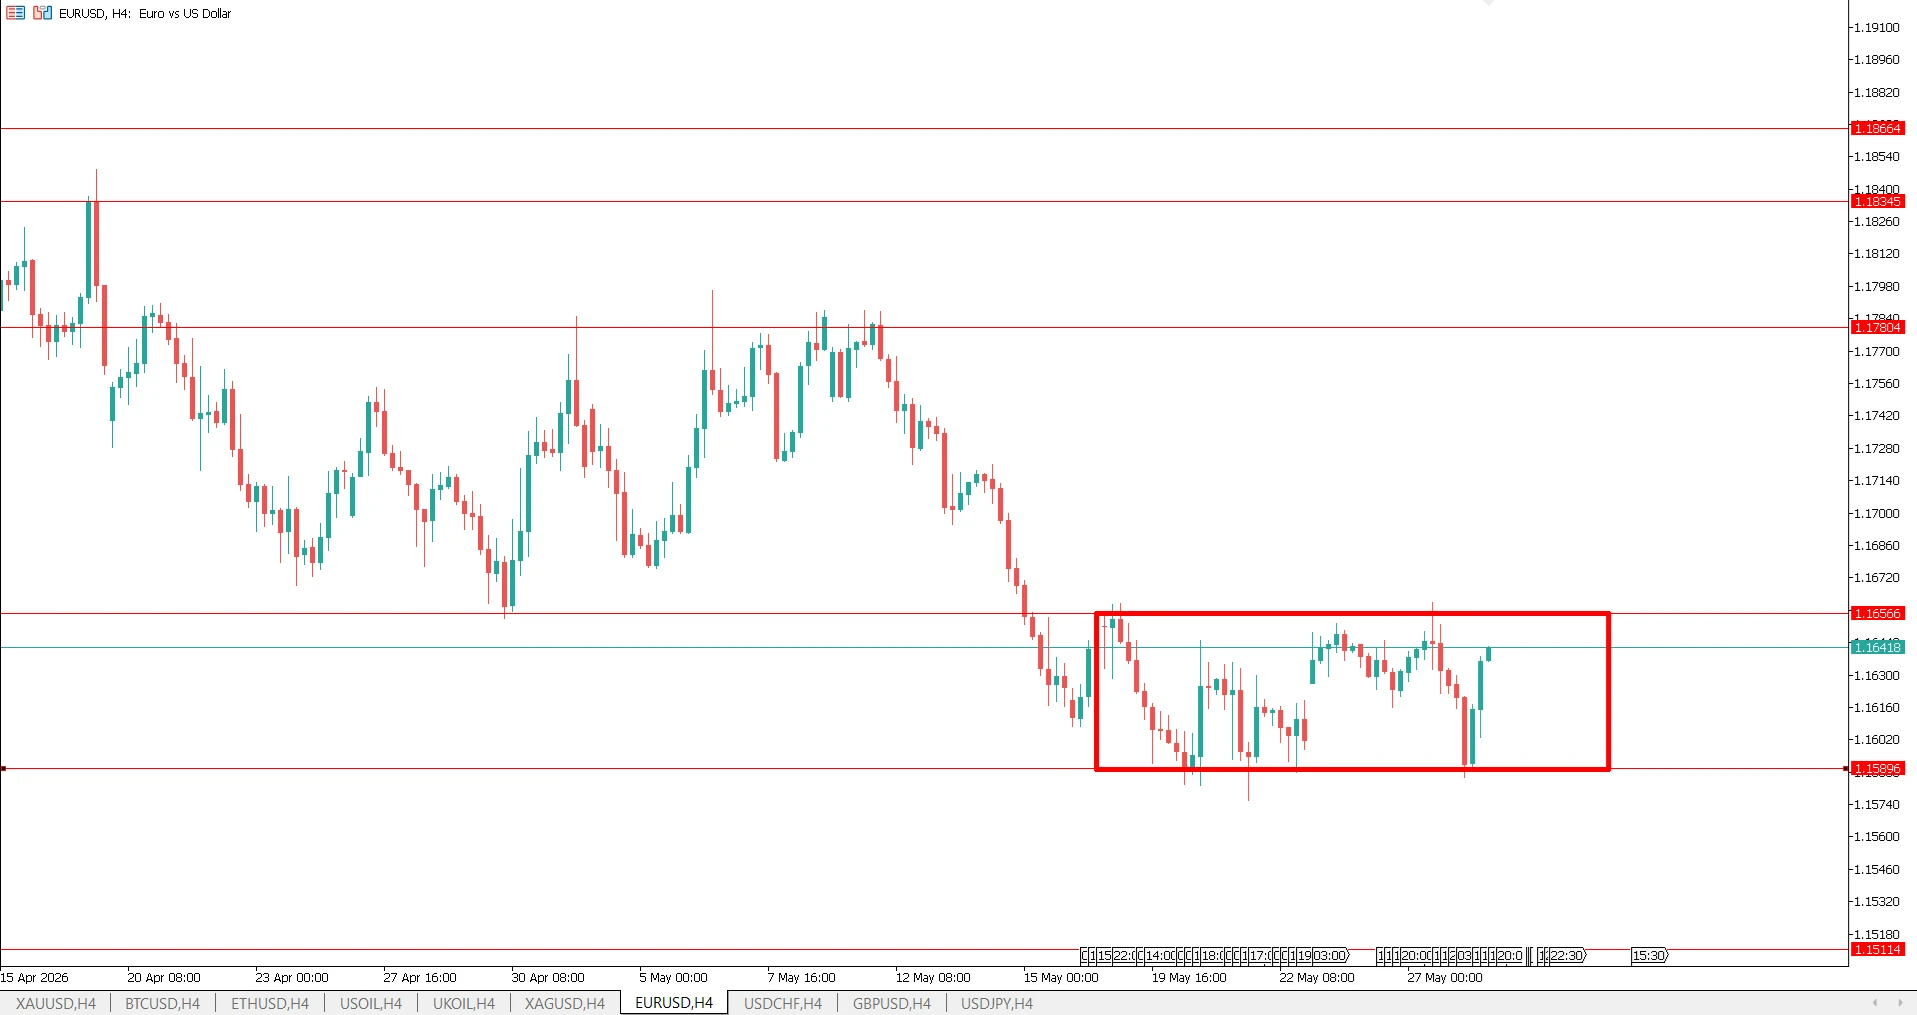
EUR/USD H4 விளக்கப்படத்தில், விலை 1.1780 பகுதியிலிருந்து கடுமையாக வீழ்ச்சியடைந்து, பின்னர் தோராயமாக 1.1650 மற்றும் 1.1590 க்கு இடையில் ஒரு தெளிவான கான்சொலிடேஷன் வரம்பிற்குள் இடைவெளி எடுத்தது. இந்த கட்டத்தில், சந்தை போக்கை நிறுத்தி பக்கவாட்டாக நகரத் தொடங்கியது, அதே மேல் மற்றும் கீழ் எல்லைகளுக்கு அருகில் மீண்டும் மீண்டும் எதிர்வினைகள் ஏற்பட்டன. ஒரு வரம்பு வர்த்தகர் பெட்டியின் கீழ் ஓரத்திற்கு அருகில் வாங்கி மேல் ஓரத்திற்கு அருகில் விற்க முயற்சி செய்யக்கூடும், அதே சமயம் ஒரு பிரேக்அவுட் வர்த்தகர் நுழைவதற்கு முன் வரம்பிற்கு வெளியே ஒரு பலமான முடிவிற்காக காத்திருப்பார். இந்த நிலையில், சந்தை தனது அடுத்த திசைசார் நகர்வை முயற்சிக்கும் முன் கான்சொலிடேஷன் ஒரு அடித்தளமாக செயல்பட்டது.
*இது நிதி ஆலோசனை அல்ல.
அடிக்கடி கேட்கப்படும் கேள்விகள்
கான்சொலிடேஷன் புல்லிஷ் அல்லது பேரிஷா?
கான்சொலிடேஷன் தானாகவே நடுநிலையானது. இதன் பொருள் சூழலைப் பொறுத்தது. ஏறுநிலை போக்குக்குப் பிறகு, இது புல்லிஷ் தொடர்ச்சியைக் குறிக்கலாம். இறங்குநிலை போக்குக்குப் பிறகு, இது பேரிஷ் தொடர்ச்சியை அல்லது ஒரு சாத்தியமான தலைகீழாதலைக் குறிக்கலாம்.
கான்சொலிடேஷன் எவ்வளவு காலம் நீடிக்கும்?
இது ஒரு குறைந்த காலக்கட்டத்தில் நிமிடங்கள் அல்லது அதிக காலக்கட்டத்தில் வாரங்கள் நீடிக்கக்கூடும். இதன் காலஅளவு சந்தை நிலைமைகள், செய்தி ஓட்டம், பணப்புழக்கம் மற்றும் வர்த்தகர் பங்கேற்பைப் பொறுத்தது.
கான்சொலிடேஷனுக்கு காரணம் என்ன?
வாங்கும் மற்றும் விற்கும் அழுத்தம் சமநிலையில் இருக்கும்போது கான்சொலிடேஷன் பொதுவாக நிகழ்கிறது. வர்த்தகர்கள் தரவுக்காக காத்திருக்கலாம், லாபம் பெறலாம் அல்லது அடுத்த நகர்வுக்கு முன் நிலைகளை உருவாக்கலாம்.
வர்த்தகர்கள் பிரேக்அவுட்டை எவ்வாறு உறுதிப்படுத்துகிறார்கள்?
வர்த்தகர்கள் பெரும்பாலும் வரம்பிற்கு வெளியே ஒரு கேண்டில் முடிவு, வலுவான வர்த்தக அளவு, மற்றும் இண்டிகேட்டர்கள் அல்லது பிரைஸ் ஆக்ஷனிலிருந்து மொமன்டம் ஆதரவைத் தேடுகிறார்கள். இந்த சிக்னல்கள் தவறான பிரேக்அவுட்டின் இடரைக் குறைக்கின்றன.
ஆசிரியரை அறிந்துகொள்வோம்
வேனசா பால்சன் நிதிச் சேவைத் துறையில் ஆன்லைன் மார்க்கெட்டிங்கில் பன்னிரண்டு ஆண்டுகளுக்கும் மேலான அனுபவம் கொண்ட NordFX-இன் மார்க்கெட்டிங் மேலாளராவார். இன்-ஹவுஸ் சூழல்களில் தேடல், சமூக ஊடகம் மற்றும் டிஸ்பிளே சேனல்களில் தரவு-உந்துதல் பிரச்சாரங்களை அவர் உருவாக்கி செயல்படுத்தியுள்ளார். சிக்கலான நிதி தயாரிப்புகள் மற்றும் வர்த்தக கருவிகளை தெளிவான, நடைமுறை கற்றல் உள்ளடக்கமாக மொழிபெயர்ப்பதில் அவரது பணி கவனம் செலுத்துகிறது, இது உலகளாவிய வர்த்தக நிலப்பரப்பைப் பற்றி ஒரு விரிவான மற்றும் ஒருங்கிணைந்த பார்வையை அவருக்கு அளிக்கிறது.
வேனசாவுடன் LinkedIn-இல் இணையுங்கள்.
திரும்பிச் செல்லவும் திரும்பிச் செல்லவும்