The falling wedge pattern is a popular chart formation in technical analysis that can signal potential market reversals or continuation. Understanding what it represents and how it behaves helps traders identify opportunities and manage risk. This article explains the falling wedge pattern in detail and offers practical guidance for interpreting it in trading.
Quick answer:
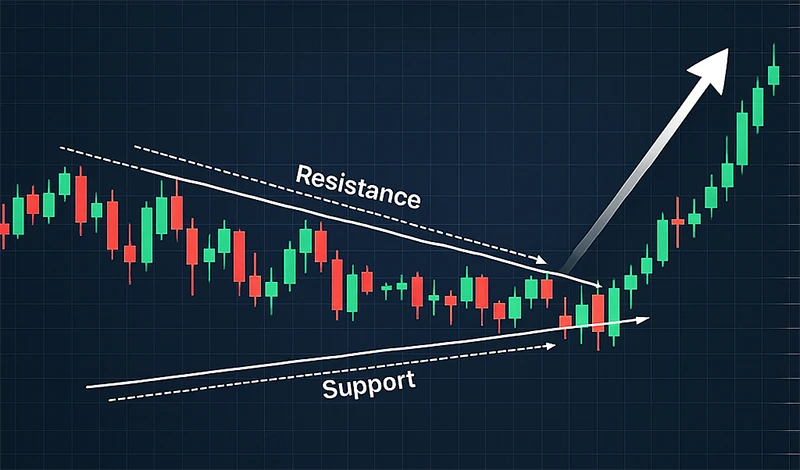
A falling wedge pattern is a chart formation where price moves downward within two converging, downward-sloping trendlines, signaling a likely bullish breakout. When price breaks above the upper trendline, it often indicates that downward momentum is losing strength and a reversal (or bullish continuation) may follow.
Key points
- The wedge forms as price makes lower highs and lower lows along converging lines.
- Falling wedge can appear during downtrends (as reversal) or after rallies (as continuation).
- Breakouts tend to be bullish — traders watch for a rise above the upper trendline.
- Volume and breakout confirmation boost reliability.
- As with all patterns, falling wedge strategy carries risk; false breakouts happen.
What Is a Falling Wedge Pattern?
A falling wedge pattern is a chart pattern used in technical analysis, defined by two downward-sloping trendlines that converge over time. The upper line connects successively lower highs, while the lower line connects successively lower lows. Importantly, the slope of the lower line is steeper (that is, the support line descends faster) than that of the upper line. This geometry creates a narrowing wedge shape on the chart.
This pattern suggests that although price continues to decline, the rate of decline is decelerating. Sellers lose momentum while buyers start to gain interest. When the price eventually breaks above the upper trendline, it often marks a turning point — a shift from bearish to bullish sentiment. That is why many traders view the falling wedge as a bullish pattern, despite its downward trajectory during formation.
While the term “wedge” might sound exotic, the falling wedge is among the more reliable reversal or continuation formations — provided it is properly identified and confirmed with other technical clues.
Key Characteristics of the Falling Wedge Pattern
The reliability of a falling wedge depends on several defining characteristics. Understanding these helps you distinguish a legitimate falling wedge from just a random collection of descending candles.
Lower highs and lower lows
Within a falling wedge, price consistently makes lower highs and lower lows. However, the lower lows fall faster than the lower highs — hence the lower boundary line is steeper. The upper boundary slopes down more gently, reflecting weakening downward momentum.
Converging trendlines
The upper and lower trendlines eventually converge — the wedge narrows as the pattern develops. This convergence reflects decreasing volatility. As the wedge tightens, traders anticipate a breakout as supply and demand reach equilibrium.
Downward-slant
Both trendlines slope downward, indicating the falling nature of the price overall. This differentiates a falling wedge from rising wedge or symmetrical wedge patterns. The downward slant is part of what makes the pattern look like a “falling” wedge.
Completion via breakout
A key characteristic is a breakout through the upper trendline. There must be a decisive move upward through resistance for the wedge to “complete.” Ideally, this breakout should be accompanied by increased trading volume. Without breakout confirmation, the wedge remains incomplete and trading based on it becomes risky.
Time span
Falling wedges typically form over several weeks to a few months (on daily charts), though they can occur on shorter-timeframe charts too. Longer formation periods often lead to stronger breakouts. Short-term wedges on intraday charts tend to be more speculative and less reliable.
Where does the falling wedge occur?
The falling wedge pattern can appear in three common contexts: during a downtrend as a reversal pattern, following a strong rally as a consolidation phase (continuation pattern), and even in range-bound markets. Understanding where it occurs helps set expectations about its likely outcome.
Downtrend reversal
One of the most classic contexts is during a downtrend. After a significant drop in price, the falling wedge appears as price makes successive lower highs and lower lows, but the pace of decline slows down. This slowing reflects weakening selling pressure. When price breaks above the upper trendline, it signals that buyers may be regaining control — a potential reversal from bearish to bullish. Traders often use this setup to enter long positions with the expectation of a trend reversal.
Post-rally consolidation (continuation)
Another common context is after a strong upward move (bullish rally). In this case, the falling wedge acts as a consolidation pattern: price retraces or corrects downwards, forming the wedge, but underlying bullish sentiment remains. A breakout upward suggests the rally is resuming. This makes the falling wedge a continuation pattern in bullish markets. In such cases, traders may add to existing long positions or open new ones expecting the uptrend to continue.
Range-bound or volatile markets
Falling wedges sometimes emerge in sideways or volatile markets, where price oscillates but gradually drifts downward. In such contexts, the wedge may precede a breakout in either direction — though upward breakouts are more commonly associated. The reliability of the pattern tends to be lower in choppy, range-bound conditions due to increased noise and lack of clear trend.
Chart timeframe matters
Falling wedges can form on any timeframe — from 5-minute intraday charts to weekly or monthly charts. However, patterns on longer timeframes (daily, weekly) generally carry more weight, as they reflect broader market sentiment. Short-term wedges may produce quick but less reliable signals. Choosing the timeframe should match your trading style (scalping, swing, position).
What the falling wedge tells us
When a falling wedge forms, it reflects a shift in market dynamics. At first glance, a wedge may look bearish — price is descending. But digging deeper, it communicates something more subtle about momentum, supply/demand balance, and investor psychology.
Diminishing bearish momentum
As the wedge narrows, the series of lower highs descends at a slower rate than the lower lows. This suggests that bearish pressure is fading: sellers push price down less forcefully, while buyers begin to step in at progressively higher levels of support. In effect, the market tread-water slows.
Supply and demand balancing
The converging trendlines imply that supply (selling interest) and demand (buying interest) are becoming more balanced. As each wave of selling becomes weaker and buyers show renewed interest, supply may run out. Often, a breakout upward happens when sellers exhaust themselves and buyers seize control. This shift can mark a transition from bearish to bullish dominance.
Potential for breakout and trend change
Because the downward movement is slowing, and supply/demand is rebalancing, the falling wedge may culminate in a bullish breakout — a strong upward move when price crosses the upper resistance line. This breakout can mark a reversal (if the wedge formed in a downtrend) or a resumption of the upward trend (if it formed after a rally).
Psychological interpretation
From a behavioral standpoint, the falling wedge shows buyer hesitation turning into buyer confidence. Each dip attracts buyers at higher lows, indicating rising demand. Simultaneously, sellers stop being as aggressive. Traders often treat the breakout as a sign that bearish sentiment is over and bullish sentiment is gaining strength.

Features of Falling Wedge Pattern
To evaluate a falling wedge properly, it helps to consider several supporting features or conditions that increase its reliability. These features act as confirmation tools beyond just the wedge’s shape. A wedge that meets more of these conditions tends to have higher predictive value.
Volume behavior
One of the most important confirming features is declining volume during the wedge formation, followed by increasing volume on breakout. Declining volume reflects lack of strong conviction behind each downward move, which supports the idea of weakening bearish pressure. When price breaks upward on rising volume, it signals genuine buying interest and reduces the risk of a false breakout.
Duration and time spent in pattern
Falling wedges that form over longer periods (weeks to months on daily charts) tend to be more meaningful than those forming in a few hours or days. Longer duration allows the market to build enough consolidation and engage more participants. Patterns on higher timeframes also tend to filter out noise and produce stronger breakouts.
Slope of trendlines
As noted, both trendlines must slope downward, and the lower line must have a steeper slope than the upper line. If slopes are equal, or the lower line is flatter, the pattern may be a different type (for example, a symmetrical triangle) and may not carry the same implications.
Symmetry in lows and highs
Though price makes lower lows and lower highs, the lower lows should not be drastically steeper than typical downswings in the prevailing trend. Ideally, the distance between successive lows decreases over time — indicating gradually receding bearish pressure. Similarly, the upper highs should descend gradually. Extreme irregular swings may invalidate the pattern.
Clear breakout through resistance
A valid signal requires that price closes (on the timeframe of the chart) above the upper trendline, not just temporarily pierces it. Traders often wait for a daily candle or close above the trendline (on daily charts) to confirm breakout. Moreover, a retest of the former resistance line (now support) can strengthen reliability. Without a clear breakout, trading on the wedge remains speculative.
Market context
The broader market conditions and trend context matter. A falling wedge in an extremely bearish overall market may carry more risk, since even a bullish breakout could be short-lived. Conversely, if the wedge forms in a context where macroeconomic or fundamental factors support a move upward, breakout potential improves.
Importance of Falling Wedge Chart Patterns
The falling wedge pattern holds value for traders across experience levels because it captures a shift in market psychology and offers actionable signals. Here’s why it matters in chart-based trading.
Early identification of reversals
For traders looking to enter markets near turning points, the falling wedge can offer early warning of a potential reversal. Compared to waiting for a trend to bottom and confirm by other indicators, a wedge can be spotted while price is still in decline — offering earlier entry opportunities, possibly with better risk/reward.
Clear strategy structure
The falling wedge provides a relatively clear framework: entry after breakout (or retest), stop-loss below recent swing low, profit target based on pattern height. This structure helps traders define trades systematically, reducing emotional decision-making and promoting discipline.
Applicability across timeframes
Because the wedge pattern can form on various timeframes, it is adaptable to different trading styles — whether you are scalping, swing trading, or holding longer-term. This flexibility makes it a versatile tool.
Integration with other analysis tools
Falling wedge often plays well with other technical tools — support/resistance zones, pivot levels, oscillators, moving averages. For example, if the wedge breakout coincides with a rising moving average or oversold reversal on an oscillator, the signal strengthens.
Risk control
Using a falling wedge encourages defined risk: a stop-loss just below the wedge’s lower boundary or last swing low limits potential loss. Risk/reward can be assessed before entering the trade, which supports disciplined trading and capital preservation.
How to Interpret Falling Wedge Pattern in Trading
Recognizing a falling wedge is just the first step. Interpreting it in actual trading requires combining the pattern with volume, timeframe, breakout confirmation, and overall market context. Below are practical steps and examples.
Step 1: Identify the wedge
Draw two trendlines: the upper line connecting at least two or more recent lower highs, and the lower line connecting at least two lower lows. Ensure both slope downward, and the wedge narrows over time. On a daily chart, a wedge forming over several weeks carries more weight.
Step 2: Observe volume
Watch whether volume declines as the wedge develops. That implies selling pressure is fading. Then monitor for volume increase when price approaches the upper trendline. Rising volume ahead of breakout strengthens the validity of a breakout.
Step 3: Wait for breakout and confirmation
Do not enter the trade merely because price touched the upper trendline. Wait for a decisive close above the upper boundary — ideally a daily candle (on daily charts) or equivalent for your timeframe. Some traders prefer a retest of the breakout level (upper trendline becomes support) before entering. This reduces the chance of falling victim to false breakouts.
Step 4: Define entry, stop-loss, and profit target
Once breakout is confirmed, place entry slightly above breakout point or after retest confirmation. Place stop-loss below the most recent swing low or below the lower trendline to account for possible false breakout. For profit target, many traders measure the vertical height of the wedge (distance between first high and low) and add that to the breakout point — giving a rough target price.
Step 5: Monitor trade with market context and risk management
Even after breakout, monitor macroeconomic events, overall trend, support/resistance zones beyond the wedge, and volume. If unexpected news or price action contradicts the breakout, consider tightening stop-loss or closing early. Always trade with appropriate position size and risk limits.
The Advantages and Risks of Wedge Pattern Strategies
Every trading strategy, including wedge-pattern trading, carries advantages and risks. Understanding both helps traders make well-informed decisions.
Advantages
- Early entry opportunities: Wedge patterns often give signals before the broader market identifies a reversal or continuation.
- Defined risk and reward: With clear entry, stop-loss and profit target zones, traders can calculate potential risk and reward.
- Flexibility across timeframes: Wedges work on intraday, daily, weekly charts — adaptable to different trading horizons.
- Combination with other tools: Wedges integrate with indicators, support/resistance zones, trendlines — offering multi-layer analysis.
- Simplifies complex market psychology: The wedge visually reflects declining bearish momentum and increasing buyer interest, making interpretation more intuitive.
Risks
- False breakouts: Price may pierce the upper trendline temporarily and then resume downward, leading to losses.
- Subjectivity in drawing trendlines: Different traders may draw the wedge slightly differently, leading to inconsistent signals.
- Unreliable in low-volume or choppy markets: In ranging or illiquid markets, wedges may form often but fail frequently.
- Dependence on timeframe: Short-term wedges are especially prone to noise and whipsaws.
- Over-reliance without context: Using wedge signal alone without regard to overall trend or fundamentals increases risk.
Because of these risks, many experienced traders wait for breakout confirmation and prefer to combine wedge signals with volume analysis, support/resistance levels, or other technical indicators.
FAQ
What is the difference between a falling wedge and a falling channel?
A falling wedge has converging trendlines — the support line slopes down more steeply than the resistance line — causing the range to narrow over time. A falling channel, by contrast, has parallel trendlines, meaning price moves downward with relatively constant amplitude. Falling channels tend to reflect a stable downtrend, while falling wedges suggest weakening bearish momentum and potential reversal or breakout.
Can a falling wedge pattern ever signal a bearish outcome?
While falling wedges are generally considered bullish, in rare cases — particularly in very bearish markets or when volume remains weak — price may break downward out of the wedge. This is more common when broader market sentiment remains negative. Therefore, it is safer to treat the falling wedge as a bullish bias rather than a guarantee.
On which timeframes does falling wedge work best?
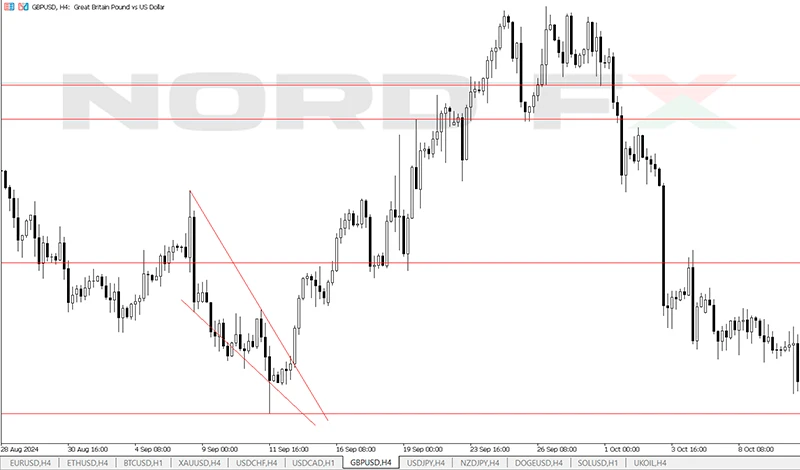
Falling wedges are most reliable on medium to long timeframes such as daily or 4-hour charts, where noise is filtered out and the pattern reflects meaningful market sentiment. Wedges on 5-minute or 15-minute intraday charts can be used by scalpers but carry higher risk due to volatility and false breakouts.
Is it enough to trade solely based on falling wedge signals?
No. Relying solely on the falling wedge without considering volume, overall trend, support/resistance zones, and risk management increases the chance of losses. Combining wedge analysis with other technical tools — such as moving averages, oscillators, or fundamental analysis — improves the chance of success.
How to manage risk when trading a falling wedge breakout?
Use a stop-loss placed below the lower trendline or recent swing low to cap downside. Limit position size so that a loss represents only a small portion of trading capital. Consider waiting for a retest (price snaps back to upper trendline after breakout) before entering, which adds confirmation and reduces false-breakout risk.
Can a falling wedge act as a continuation pattern, not just a reversal?
Yes. When a wedge forms after a strong uptrend, it may represent consolidation or a pause before the uptrend resumes. A breakout upward in that context can signal continuation, giving traders a chance to add to existing positions or open new ones aligned with the broader trend.
Does volume always need to increase on breakout for the wedge to be valid?
While rising volume strengthens the validity of a breakout, it is not strictly mandatory. Some wedge breakouts occur on moderate volume but still sustain. However, breakouts on declining or flat volume are more prone to failure and should be treated with caution or confirmed with additional signals.
How far might price move after a breakout from a falling wedge?
A common method is to measure the vertical height of the wedge (distance between first high and first low) and project that upward from breakout level to estimate a target. However, actual movement may be more or less than the projected target, depending on market conditions. Traders should be ready to exit earlier or let profits run with trailing stops.
กลับ กลับ
