Divergence in trading is one of the most valuable concepts in technical analysis. For intermediate traders looking to refine their market entries and exits, recognizing divergence patterns can provide a clearer picture of potential reversals or trend continuations. This technique is especially powerful when combined with momentum indicators, offering insights that price action alone may not reveal.
What is Divergence in Trading?
Divergence occurs when the price of an asset is moving in the opposite direction of a technical indicator, usually an oscillator. This disconnect can signal that the current trend is weakening or may soon reverse. Divergence is not a guarantee of a change in trend, but it often serves as an early warning sign, allowing traders to prepare for possible market shifts.
Divergence in trading is typically analyzed using indicators like RSI (Relative Strength Index), MACD (Moving Average Convergence Divergence), and the Stochastic Oscillator. These tools measure momentum and help identify when an asset’s price movement may be misleading.
Types of Divergence
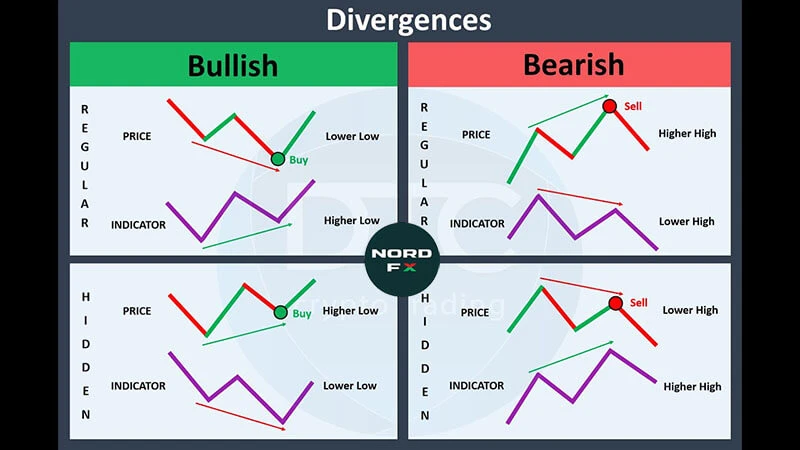
Regular Divergence
Regular divergence is commonly associated with potential trend reversals. It suggests that momentum is fading even though the price may still be making new highs or lows.
Bullish Regular Divergence
- Occurs when: Price forms lower lows, but the indicator forms higher lows.
- Implication: The downtrend may be weakening, signaling a potential bullish reversal.
Bearish Regular Divergence
- Occurs when: Price forms higher highs, but the indicator forms lower highs.
- Implication: The uptrend may be losing strength, indicating a possible bearish reversal.
Hidden Divergence
Hidden divergence, on the other hand, suggests a potential continuation of the existing trend. It indicates that although price corrections are happening, the underlying trend remains strong.
Bullish Hidden Divergence
- Occurs when: Price forms higher lows, but the indicator forms lower lows.
- Implication: The uptrend is likely to continue after a brief correction.
Bearish Hidden Divergence
- Occurs when: Price forms lower highs, but the indicator forms higher highs.
- Implication: The downtrend is likely to persist despite a short-term rally.
Indicators Commonly Used for Divergence
Several momentum indicators are used to spot divergence. Each has its own advantages and works slightly differently.
Relative Strength Index (RSI)
RSI is one of the most popular tools for identifying overbought and oversold conditions. It moves between 0 and 100 and often signals divergence when the price trend and the RSI trend are out of sync.
- RSI divergence is frequently used to confirm potential reversals.
- A divergence signal on RSI carries more weight when RSI is near extreme levels (above 70 or below 30).
Moving Average Convergence Divergence (MACD)
MACD uses two moving averages to measure momentum and trend direction. Divergence is typically observed between the price and the MACD line or histogram.
- MACD divergence is considered more reliable in trending markets.
- A crossover following a divergence often strengthens the signal.
Stochastic Oscillator
This momentum indicator compares a security’s closing price to its price range over a specific period.
- Stochastic divergence can help detect overbought or oversold conditions.
- Like RSI, it’s most useful in range-bound markets.
Comparing Divergence Types
Here’s a quick summary of divergence types and what they generally imply:
Divergence Type | Price Action | Indicator Action | Implication |
Bullish Regular | Lower Lows | Higher Lows | Potential Reversal Up |
Bearish Regular | Higher Highs | Lower Highs | Potential Reversal Down |
Bullish Hidden | Higher Lows | Lower Lows | Trend Continuation Up |
Bearish Hidden | Lower Highs | Higher Highs | Trend Continuation Down |
How to Use Divergence Across Different Markets
While divergence is a universal concept in trading, its interpretation can vary slightly depending on the market being traded.
Forex
In forex trading, divergence is particularly effective due to the high liquidity and well-defined trends. Traders often use RSI divergence to spot turning points in currency pairs, especially on higher timeframes like H4 or daily charts.
Commodities
In commodities like gold, oil, or silver, divergence helps identify trend exhaustion after a period of strong momentum. MACD divergence can be useful here, especially when coupled with volume analysis.
Cryptocurrencies
Crypto markets are known for their volatility, which makes divergence both a valuable and risky tool. Because of frequent false breakouts, it’s crucial to combine divergence signals with strong support/resistance levels or candlestick patterns for confirmation.

Key Considerations and Limitations
Although divergence can be a powerful tool, it has limitations that traders should keep in mind.
False Signals
Not every divergence leads to a reversal. Sometimes, divergence can persist for a long time without any meaningful price change. This is why divergence should not be used in isolation.
Importance of Confirmation
Always use divergence alongside other indicators or chart patterns. Waiting for confirmation—such as a trendline break or a candlestick reversal pattern—can reduce the risk of entering trades prematurely.
Timeframe Sensitivity
Divergence signals are generally more reliable on higher timeframes (e.g., H4, daily) than on short-term charts. Noise and rapid price fluctuations on smaller timeframes can generate misleading signals.
Conclusion
Divergence in trading offers a deeper understanding of market momentum and can act as an early warning system for potential reversals or trend continuations. By learning to identify regular and hidden divergence using tools like RSI, MACD, and the Stochastic Oscillator, traders can improve their technical analysis and make more informed decisions.
While divergence should not be used as a standalone signal, when applied carefully and with proper risk management, it becomes a valuable addition to any trader’s toolbox—across forex, commodities, and even the ever-volatile crypto markets.
FAQ
1. What is divergence in trading?
Divergence in trading occurs when the price of an asset moves in the opposite direction of a momentum indicator, such as RSI or MACD. It often signals a potential reversal or continuation in trend, depending on the type of divergence.
2. What’s the difference between regular and hidden divergence?
Regular divergence typically signals a possible trend reversal. For example, when price makes a higher high but the indicator makes a lower high, it may suggest weakening momentum. Hidden divergence, on the other hand, indicates potential trend continuation, reinforcing the existing trend after a pullback.
3. Which indicators are best for spotting divergence?
The most commonly used indicators for identifying divergence are the Relative Strength Index (RSI), Moving Average Convergence Divergence (MACD), and the Stochastic Oscillator. Each helps traders assess momentum and spot discrepancies between price and indicator movement.
4. Can divergence be used in all markets?
Yes, divergence can be applied across a wide range of markets, including forex, commodities, and cryptocurrencies. While the core concept remains the same, traders should always adapt their analysis based on the unique characteristics and volatility of each market.
5. Is divergence alone enough to enter a trade?
No, divergence should not be used as a standalone signal. It’s most effective when combined with other technical tools, such as support and resistance levels, trendlines, or candlestick patterns, to confirm trading decisions and reduce the risk of false signals.

