SMT divergence stands for “Smart Money Tools” divergence and refers to identifying divergence across correlated pairs or markets rather than within a single asset’s price and indicator. It matters because it adds a layer of context beyond single‐instrument signals, helping traders see when underlying relative strength or weakness may not be reflected in price alone.
Quick answer:
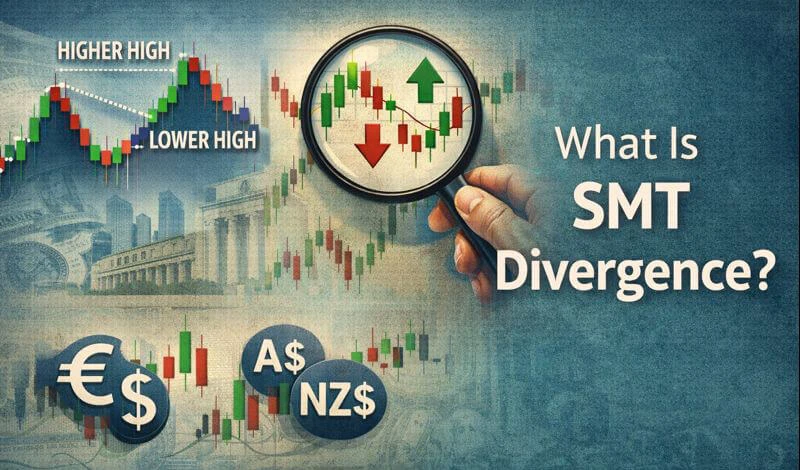
SMT divergence occurs when the price of an instrument makes a new high or low that is not confirmed by the correlated instrument, suggesting a possible reversal, continuation pause, or shift in momentum between markets or pairs.
SMT divergence is a technical concept used by many traders to identify potential turning points in financial markets. It compares price action on one instrument with price movement on a related or correlated instrument to find discrepancies that may signal shifts in momentum. Understanding SMT divergence can help traders improve timing and context around entry and exit decisions.
Key Takeaways
- SMT divergence highlights differences in momentum between correlated markets, helping traders spot potential weakness or imbalance earlier than single-chart analysis.
- Strong and stable correlations are essential, as SMT divergence relies on related instruments reacting similarly under normal market conditions.
- The concept works best when combined with market structure, support and resistance, or indicator confirmation rather than used on its own.
- Higher time frames tend to produce clearer and more reliable SMT divergence signals, while lower time frames require extra caution.
- SMT divergence often signals slowing momentum or short-term corrections rather than guaranteed reversals, making risk management critical.
What Is SMT Divergence?
SMT divergence is a type of inter-market divergence where you compare price action on one market, currency pair, or instrument with another related market. Unlike classic divergence that involves price and an indicator (such as RSI, MACD), SMT divergence looks for imbalance between two correlated instruments. For example, if one currency pair makes a new high while a related pair does not make a corresponding high, this mismatch can signal that the momentum behind the move is weakening.
This method is often used in forex and CFDs because many currency pairs have strong correlations or inverse relationships. SMT divergence tries to capture when the “smart money” appears to be active in one instrument but not in another, indicating a potential shift.
The key components are:
One primary instrument whose trend you are analyzing A second instrument that is expected to move in a similar (or predictable opposite) direction Correlated behavior that fails to materialize, evidencing divergence
In practice, the divergence can be bullish or bearish. Bullish SMT divergence happens when price makes a lower low but the correlated instrument does not confirm that low. Bearish SMT divergence happens when price makes a higher high but the correlated instrument does not confirm that high.
Why Does It Work?
SMT divergence works based on the idea that related markets should exhibit similar underlying strength or weakness. When they do not, it suggests that the move in the primary instrument may lack broader market support. Correlations form because of economic linkages, interest rate differentials, commodity relationships, and common participants in markets.
There are a few reasons SMT divergence can be meaningful:
Market psychology: Traders and institutions often move across related instruments. If one market moves strongly but its correlated partner does not, it can signal hesitation or lack of conviction. Liquidity flows: Large players may influence one market ahead of another, creating early signals through relative movement. Interlinked fundamentals: Currencies and assets that share economic drivers often should trend together. When they do not, the divergence may reveal shifts in those fundamentals or positioning.
Another way to think about it is that divergence is a type of confirmation tool. If price continues to make extreme readings but the related market does not, the trend may be less sustainable.
How Do You Look for SMT Divergence?
Finding SMT divergence requires you to identify correlated pairs and then watch for mismatches in their price behavior. The basic steps are:
- Choose two related instruments
- Plot their price action on separate charts or a single chart with offsets
- Look for new highs or lows on one that are not confirmed on the other
- Confirm with supporting signals or context
In forex, pairs often compared are EURUSD with GBPUSD, AUDUSD with NZDUSD, or USDCHF with USDJPY, depending on the correlation direction. Table 1 shows example correlations and expected relative movement.
Table 1: Examples of Correlated Pairs
Instrument A | Instrument B | Correlation | Expectation |
EURUSD | GBPUSD | Positive | Move in a similar direction |
USDCHF | USDJPY | Positive | Move in a similar direction |
AUDUSD | NZDUSD | Positive | Move in a similar direction |
EURUSD | USDCHF | Negative | Move in opposite directions |
GBPUSD | USDJPY | Negative | Move in opposite directions |
In this table, positively correlated pairs tend to move together; negatively correlated pairs tend to move in opposite directions. When one makes a significant swing without confirmation from its correlated counterpart, that is where SMT divergence may occur.
Technical tools can help. Many platforms allow overlaying one price chart over another or standardizing price to a percentage scale so relative peaks and troughs can be compared visually. You look at swing highs and lows on both and check if their timing and magnitude align.
Bearish SMT divergence example: Pair A makes a higher high, but Pair B’s corresponding high is lower than its previous one. Bullish SMT divergence example: Pair A makes a lower low, but Pair B’s corresponding low is higher than its previous one.
What Time Frames Should I Look for SMT Divergence?
Time frame choice depends on your trading style and the market you are analyzing. Larger time frames generally provide stronger signals because they reflect broader market participation, but they occur less frequently. Smaller time frames may give more signals but also more noise.
Day traders may watch 15-minute to 1-hour charts. Swing traders often use 4-hour or daily charts. Position traders might observe daily to weekly charts. The principle is similar: longer time frames tend to reduce the impact of random fluctuations and better reflect underlying trend divergence.
A practical approach is to identify the broader trend on a higher time frame and then look for SMT divergence on an intermediate time frame to time entries. For example, if the daily trend is up, daily charts might show a divergence that signals a possible slowdown. You can then use lower time frames to refine entries and exits.

Best Pairs for SMT Divergence
Not all markets are equally suitable for SMT divergence. Ideally, the instruments should have a stable and reliable correlation. In forex, majors and crosses with common base or quote currencies often work well because their economic linkages are stronger.
Pairs such as EURUSD and GBPUSD are popular because both share the US dollar as the quote currency and reflect related economic drivers. Similarly AUDUSD and NZDUSD are linked through commodity exposure and similar economic profiles.
Correlations are dynamic, though. They can change over time as economic conditions and market sentiment shift. A pair that was once correlated may weaken its relationship in certain environments.
Commodity currencies such as AUD, NZD, CAD often show meaningful relative behavior linked to commodities like oil and metals. Crosses within these can also provide divergence signals.
Cryptocurrency traders sometimes use SMT divergence across related digital assets like Bitcoin and Ethereum, but correlations in crypto can be less stable than in forex. Similarly, indices and commodity pairs may reflect divergent momentum that traders can analyze.
Combining SMT Divergence with Other Concepts
SMT divergence is often more effective when combined with other technical and fundamental considerations. It should not be used in isolation.
One way is to use classic indicator divergence (such as RSI or MACD) in concert with SMT divergence. If both the inter-market divergence and the indicator divergence point to the same potential reversal, the conviction increases.
Another method is to combine divergence with support and resistance. If SMT divergence occurs near a key support or resistance level, it may add context to the likelihood of a bounce or rejection.
Trend lines and moving averages can also frame divergence within a broader trend context. Divergence against the trend often suggests a pullback, while divergence in the direction of the trend may signal continuation weakness.
Fundamental events can amplify or disrupt divergence signals. An economic release or policy move can create divergence short-term that resolves rapidly, so understanding scheduled events and market context helps frame SMT divergence.
How Traders May Use the SMT Divergence Strategy
Traders use SMT divergence in different ways depending on their style and time horizon:
Entry timing: Divergence can help traders time entries when a potential reversal or pullback is forming. For example, a trader might wait for SMT divergence followed by a break of a short-term swing low or high before entering. Confirmation triggers: Traders often look for a confirmation pattern such as a candlestick reversal after divergence appears. Risk management: Divergence can also help define risk zones. If divergence suggests a weakening move but price still advances, traders may tighten stops or reduce position sizes.
Some traders set alerts for when correlations break down. This alert can prompt a closer look at potential setups framed by SMT divergence.
Risk management is central. Divergence signals are not guarantees. Traders often use stop-loss orders beyond recent highs or lows to manage risk if the divergence signal does not materialize into a meaningful move.
SMT Divergence in Different Market Conditions
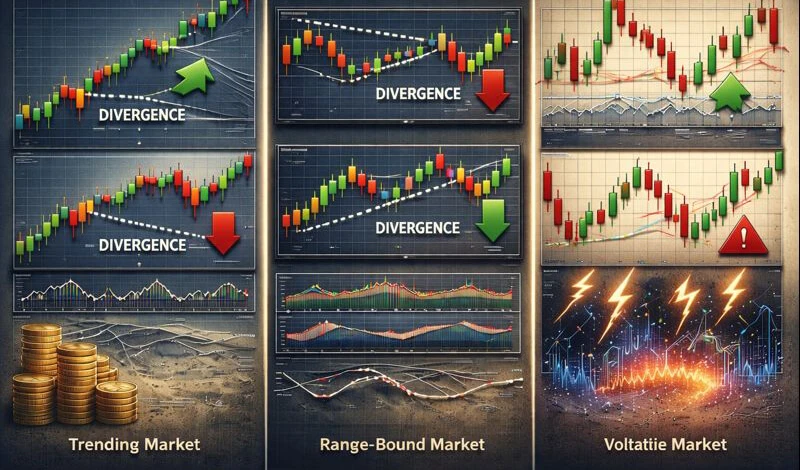
Markets behave differently under trending, range-bound, and volatile conditions, and SMT divergence may produce varying reliability.
In trending markets, divergence may signal temporary pullbacks rather than full reversals. Traders in strong trends often treat divergence as a signal to take partial profits or tighten stops rather than exit entirely.
In range-bound markets, divergence can be more frequent but less reliable without additional context. When support and resistance levels are well-defined, divergence near these levels can help identify bounce zones.
High-volatility environments can produce false signals. Rapid swings may create apparent divergence that quickly resolves as instruments realign. In such conditions, traders may increase confirmation requirements or widen stop levels.
During low-volatility periods, divergence signals may be fewer but cleaner. Price action tends to be more orderly, so divergence can reflect genuine shifts in relative strength.
Limitations and Common Misconceptions of SMT Divergence
SMT divergence is a useful tool, but it has limitations. It is not a standalone system for making trading decisions. Divergence does not always lead to a reversal; sometimes price catches up with its correlated partner and continues the trend.
Correlation can change over time. What was historically a reliable relationship can weaken or flip under new market regimes. Traders who rely solely on historical correlation without monitoring current behavior may misinterpret divergence.
Another misconception is that divergence always predicts a major reversal. Often it suggests a pause or minor correction rather than a full trend change. The context of the overall trend and broader market drivers must be considered.
Signal timing can also be tricky. Divergence may appear early, and price can continue in the original direction for a time before reversing, leading to premature entries.
The Bottom Line
SMT divergence is a technique that compares price action between correlated instruments to find mismatches that may signal shifts in momentum. It works best when used alongside other tools and contextual analysis. Knowing how to identify and confirm divergence within the market structure can add depth to your technical toolkit. Like all methods, it has limitations and performs differently across environments and time frames.
FAQ
How reliable is SMT divergence in forex trading?
SMT divergence adds context by comparing related instruments, which can enhance signal reliability over single-instrument indicators. However, it is not foolproof and should be confirmed with other tools and market context.
Can SMT divergence predict major market reversals?
It can signal potential reversals, but often it indicates a weakening of momentum or a pause rather than a definitive turn. Combining it with support/resistance and other signals improves usefulness.
Is SMT divergence suitable for short-term trading?
Yes, it can be used on shorter time frames, but noise is greater, and signals may be less reliable. Additional confirmation filters are important for short-term setups.
Do correlations used for SMT divergence stay constant?
No, correlations can shift over time. Regularly reviewing the relationship between instruments helps ensure divergence signals remain meaningful.
Should I use indicators with SMT divergence?
Many traders use indicators like RSI, MACD, or moving averages as confirmation alongside SMT divergence to strengthen entry and exit decisions.
بازگشت بازگشت
