මැයි 18–22 සතිය නිර්වචනය වූයේ බලවේග දෙකකින්: ශක්තිවත් FOMC මිනිත්තු සහ හෝර්මුස් සමුද්ර සන්ධිය ගැන රාජ්යතාන්ත්රිකව විවෘත ගිවිසුමකට ළඟා විය හැකි යයි යන ප්රකාශ. අප්රේල් 29 FOMC මිනිත්තු (මැයි 20, බදාදා නිකුත් කළ) ගැඹුරින් බෙදී ගිය Fed එකක් තහවුරු කළේය: "බොහෝ සහභාගිවන්නන් ලිහිල් කිරීමේ නැඹුරු ඉවත් කිරීමේ කැමැත්ත ඇති බව දැක්වූ" අතර, උද්ධමනය දිගින් දිගටම පවතිතොත් පොලී ශ්රේණිය ඉහළ නැංවීම සාධාරණ යයි බහුතරය සිතූහ. CME FedWatch දැන් දෙසැම්බර් පොලී ශ්රේණිය ඉහළ නැංවීමේ ~35% සම්භාවිතාව නිරූපණය කරයි; 2026 පොලී ශ්රේණිය කැපීම් සම්පූර්ණයෙන් ගෙවී ගොස් ඇත. භූ-දේශපාලනික ක්ෂේත්රයේ, ඇමෙරිකා රාජ්ය ලේකම් රූබියෝ – ඉරාන සාකච්ඡා, පාකිස්ථානය හරහා – "සුළු ප්රගතියක්" ඇති බව පිළිගත්තේය; ටෙහ්රාන් නවතම ඇමෙරිකා යෝජනාව "අර්ධ වශයෙන් හිදැස් සකස් කරයි" යයි ශ්රේෂ්ඨ නායකයා ශෝධිත යුරේනියම් ඉරානය තුළ රඳවා ගෙන සිටීමට නිර්දේශ කළ නිසා සම්පූර්ණ ගිවිසුමකට ව්යූහාත්මකව ළඟා ගැනීම දුෂ්කර ය. ගිවිසුමකට ළඟා විය හැකි යයි සිතා වෙළඳපොළ ඉහළ ගිය අතර ශ්රේෂ්ඨ ලෙස සතිය 6%කින් ඉහළ ගියේය; IEA ගෝලීය බ්රෙන්ට් ලෙහෙසි නිෂ්පාදනය – 2026 ඔක්තෝබර් දක්වා ද්රව්යමය ලෙස ඌන සැපයුමෙන් රැඳෙනු ඇතැයි නැවතත් ප්රකාශ කළේය. S&P Global Eurozone Flash PMI (මැයි 22) 2023 අගභාගයේ සිට වේගවත්ම සංකෝචිත ශ්රේෂ්ඨ Eurozone සංකෝචනය පෙන්නුම් කළ; Eurozone CPI ආසන්න මාසවලදී 4% ට ළඟා විය හැකි යයි S&P Global අවවාද කළේය. ECB ජූනි රැස්වීමේ තවත් පොලී ශ්රේණිය ඉහළ නැංවීමේ දොරටු ඇරෙන ඇතැයි සෑහිය.
මැයි 25–29 සාර්ව පසුබිම: Fed 3.50–3.75%; ECB ජූනි පොලී ශ්රේණිය ඉහළ නැංවීමේ ඉඩ; DXY 99 ඉහළ.
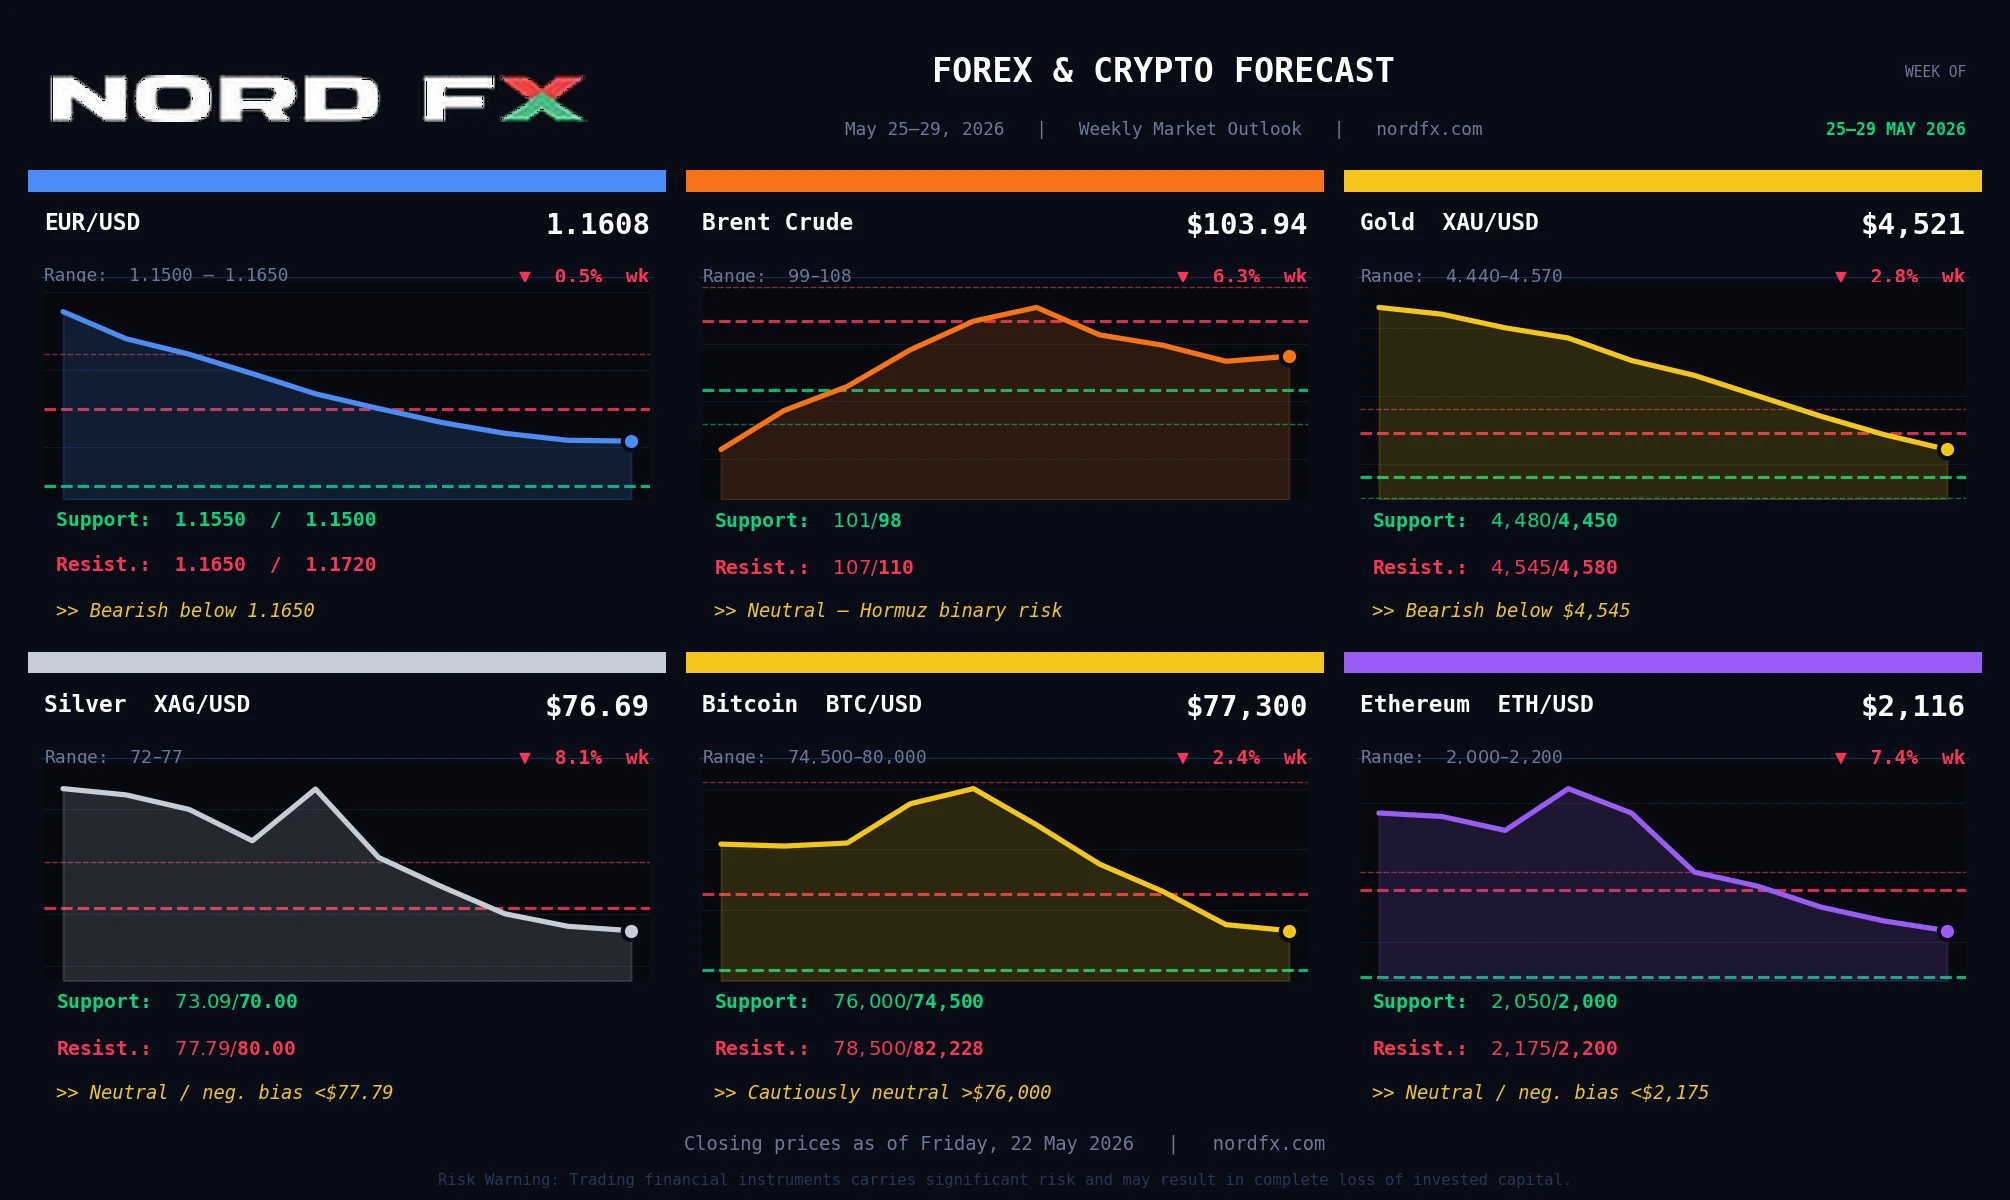
සිකුරාදා, 2026 මැයි 22 – වසා දෙමීමේ මිල:
EUR/USD – 1.1608 | බ්රෙන්ට් ක්රූඩ් ඔයිල් ෆියුචර්ස් – $103.94 | රන් (XAU/USD) – $4,521 | රිදී (XAG/USD) – $76.69 | බිට්කොයින් (BTC/USD) – $77,300 | ඉතීරියම් (ETH/USD) – $2,116
ප්රධාන සාර්ව දිනදර්ශනය, මැයි 25–29: එ.ජා. වෙළඳපොළ සඳුදා මැයි 25 නිවාඩු (Memorial Day). අඟහරුවාදා: එ.ජා. පාරිභෝගික විශ්වාසය සහ කල්පැවැති භාණ්ඩ ඇණවුම්; ජර්මනිය GfK; Eurozone ආර්ථික හැඟීම. බදාදා: EIA ක්රූඩ් ගොඩ. බ්රහස්පතින්දා: එ.ජා. Q1 GDP – දෙවන ඇස්තමේන්තුව (කේන්ද්රීය සිදුවීම); ආරම්භක රැකියා ඉල්ල හිමිකම්; නිරාවරණ නිවාස විකිණුම්. සිකුරාදා: එ.ජා. PCE උද්ධමනය (Fed ප්රිය මාපකය); Chicago PMI; Michigan හැඟීම් අවසාන; Eurozone සහ ජර්මනිය ශ්රේෂ්ඨ CPI. සටහන: FOMC රැස්වීම් නිශ්ශබ්ද කාලය මැයි 29 සිට ආරම්භ.
EUR/USD
EUR/USD 1.1608 හිදී සිටී (Investing.com කලින් වසා දෙමීම 1.1621; දෛනික පරාසය 1.1588–1.1626; 52-සතී පරාසය 1.1210–1.2079). ශක්තිවත් FOMC මිනිත්තු සහ 99 ඉහළ DXY – USD ශක්තිමත් වීමෙන් EUR/USD සතිය පහළ ගියේය. 20-දින SMA (~1.1650) සහ 100-දින SMA (~1.1630) ශ්රේෂ්ඨ ලෙස, EUR/USD ශ්රේෂ්ඨ ලෙස ශ්රේෂ්ඨ ලෙස ශ්රේෂ්ඨ ලෙස බිඳ වැටෙමින් ශ්රේෂ්ඨ. Investing.com සංඥා: සියලු කාල රාමු ශක්තිවත් විකිණීම; RSI ~40 – අධික විකිණීම් කලාපයට ළඟා. ECB ජූනි ඉහළ නැංවීම EUR/USD ශ්රේෂ්ඨ ලෙස ශ්රේෂ්ඨ ලෙස ශ්රේෂ්ඨ.
ප්රධාන උත්ප්රේරක: එ.ජා. පාරිභෝගික විශ්වාසය සහ කල්පැවැති භාණ්ඩ (අඟ) – දුර්වල ශ්රේෂ්ඨ USD ශ්රේෂ්ඨ EUR/USD 1.1530–1.1500 ශ්රේෂ්ඨ ශ්රේෂ්ඨ. Q1 GDP (බ්රහ) – ශ්රේෂ්ඨ 1.1680 ශ්රේෂ්ඨ. PCE (සිකු) – ශ්රේෂ්ඨ: ශ්රේෂ්ඨ USD ශ්රේෂ්ඨ; ශ්රේෂ්ඨ ශ්රේෂ්ඨ. Eurozone සාරාංශ CPI (සිකු) – 4% ශ්රේෂ්ඨ ECB ශ්රේෂ්ඨ EUR/USD ශ්රේෂ්ඨ. ශ්රේෂ්ඨ ශ්රේෂ්ඨ ශ්රේෂ්ඨ.
ප්රතිරෝධය: 1.1650, 1.1680, 1.1720 ආධාරය: 1.1550, 1.1500, 1.1483–1.1497
මූලික දෘෂ්ටිය: 1.1650 යටින් Bears. 200-දින SMA (~1.1615) ශ්රේෂ්ඨ ශ්රේෂ්ඨ; 1.1550 ශ්රේෂ්ඨ 1.1500–1.1483 ශ්රේෂ්ඨ. PCE ශ්රේෂ්ඨ Hormuz ශ්රේෂ්ඨ. ශ්රේෂ්ඨ: 1.1500–1.1650.
බ්රෙන්ට් ක්රූඩ් ඔයිල්
බ්රෙන්ට් $103.94 හිදී සිටී (Investing.com $102.58; $101.34–$106.36; 52-සතී $58.72–$126.41). මැයි 15 $107 ශ්රේෂ්ඨ සිට සතිය 6%+ ශ්රේෂ්ඨ Hormuz ශ්රේෂ්ඨ ශ්රේෂ්ඨ ශ්රේෂ්ඨ. Investing.com දෛනික කාල රාමු මධ්යස්ථ ශ්රේෂ්ඨ ශ්රේෂ්ඨ.
ප්රධාන උත්ප්රේරක: Hormuz ශ්රේෂ්ඨ (ශ්රේෂ්ඨ). EIA ශ්රේෂ්ඨ (බදා/බ්රහ). Q1 GDP (බ්රහ). Eurozone CPI (සිකු). ශ්රේෂ්ඨ.
ප්රතිරෝධය: $107.00, $110.00, $114.00 ආධාරය: $101.00, $98.00, $95.00
මූලික දෘෂ්ටිය: ශ්රේෂ්ඨ. Hormuz ශ්රේෂ්ඨ $15–20 ශ්රේෂ්ඨ; $112+. ශ්රේෂ්ඨ: $99–$108.
රන් (XAU/USD)
රන් (XAU/USD ස්ථානය) $4,521 හිදී සිටී (Investing.com $4,521.68; $4,507–$4,546; 52-සතී $3,245–$5,595). −2.8% සතිය $4,652 ශ්රේෂ්ඨ සිට. 50-දින SMA (~$4,538) ශ්රේෂ්ඨ; 100-දින SMA (~$4,490) ශ්රේෂ්ඨ. Investing.com: විකිණීම. Goldman Sachs $5,400, JPMorgan $5,900 ශ්රේෂ්ඨ.
ප්රධාන උත්ප්රේරක: PCE (සිකු): ශ්රේෂ්ඨ $4,480–$4,450; ශ්රේෂ්ඨ $4,580–$4,640. Q1 GDP (බ්රහ). ශ්රේෂ්ඨ ශ්රේෂ්ඨ. Michigan (සිකු).
ප්රතිරෝධය: $4,545, $4,580, $4,650 ආධාරය: $4,480, $4,450, $4,400
මූලික දෘෂ්ටිය: $4,545 ශ්රේෂ්ඨ. PCE: $4,400; $4,580+. ශ්රේෂ්ඨ: $4,440–$4,570.
රිදී (XAG/USD)
රිදී (XAG/USD) $76.69 හිදී සිටී (Investing.com $76.6875; 52-සතී $31.64–$121.67). $77.79 20-දින EMA ශ්රේෂ්ඨ. Investing.com: විකිණීම.
ප්රධාන උත්ප්රේරක: PCE (සිකු): ශ්රේෂ්ඨ $72–$70; ශ්රේෂ්ඨ $78–$80. PMI (සිකු). Q1 GDP (බ්රහ). 15% ශ්රේෂ්ඨ ශ්රේෂ්ඨ ශ්රේෂ්ඨ. EIA (බදා).
ප්රතිරෝධය: $77.79 (20-දින EMA), $80.00, $83.00 ආධාරය: $73.09, $70.00, $67.50
මූලික දෘෂ්ටිය: $77.79 ශ්රේෂ්ඨ. PCE. ශ්රේෂ්ඨ: $72–$77.
බිට්කොයින් (BTC/USD)
බිට්කොයින් $77,300 ආසන්නයේ ගනුදෙනු විය (Yahoo Finance $77,546; 52-සතී ඉහළ $132,000+), $79,157 සිට −2.4% සතිය. Bitcoin ETF ශ්රේෂ්ඨ ($360M ශ්රේෂ්ඨ ශ්රේෂ්ඨ) 7-වසරක අඩු ශ්රේෂ්ඨ. 200-දින EMA (~$82,228) BTC ශ්රේෂ්ඨ ශ්රේෂ්ඨ. BlackRock IBIT ~812,000 BTC (~$62B); spot ETF ශ්රේෂ්ඨ $58.5B. CLARITY Act (ශ්රේෂ්ඨ නියාමන ශ්රේෂ්ඨ) ශ්රේෂ්ඨ.
ප්රධාන උත්ප්රේරක: PCE (සිකු) – ශ්රේෂ්ඨ $75,000 ශ්රේෂ්ඨ; ශ්රේෂ්ඨ BTC 200-දින EMA ශ්රේෂ්ඨ. Q1 GDP (බ්රහ) – ශ්රේෂ්ඨ BTC ශ්රේෂ්ඨ. CLARITY Act ශ්රේෂ්ඨ – ශ්රේෂ්ඨ. ශ්රේෂ්ඨ ශ්රේෂ්ඨ – ශ්රේෂ්ඨ. Memorial Day ශ්රේෂ්ඨ ශ්රේෂ්ඨ.
ප්රතිරෝධය: $78,500, $80,000, $82,228 (200-දින EMA) ආධාරය: $76,000, $74,500, $72,000
මූලික දෘෂ්ටිය: $76,000 ශ්රේෂ්ඨ. ශ්රේෂ්ඨ $58.5B ETF ශ්රේෂ්ඨ. 200-දින EMA $82,228 ශ්රේෂ්ඨ; ශ්රේෂ්ඨ $84,000–$86,000. ශ්රේෂ්ඨ: $74,500–$80,000.
ඉතීරියම් (ETH/USD)
ඉතීරියම් $2,116 හිදී ගනුදෙනු විය (Yahoo Finance $2,115.89; 52-සතී $1,388–$4,956). BTC ශ්රේෂ්ඨ ETH ශ්රේෂ්ඨ: 50-දින EMA (~$2,175) සහ 200-දින MA (~$2,200) ශ්රේෂ්ඨ. Investing.com: ශක්තිවත් විකිණීම. CLARITY Act ETH ශ්රේෂ්ඨ.
ප්රධාන උත්ප්රේරක: PCE (සිකු) – ETH ශ්රේෂ්ඨ; $2,000 ශ්රේෂ්ඨ $1,950. CLARITY Act – ETH ශ්රේෂ්ඨ. Q1 GDP (බ්රහ). ශ්රේෂ්ඨ. ශ්රේෂ්ඨ ශ්රේෂ්ඨ ETH ශ්රේෂ්ඨ. ශ්රේෂ්ඨ ශ්රේෂ්ඨ ශ්රේෂ්ඨ.
ප්රතිරෝධය: $2,175 (50-දින EMA), $2,200 (200-දින MA), $2,320 ආධාරය: $2,050, $2,000, $1,950
මූලික දෘෂ්ටිය: $2,175 ශ්රේෂ්ඨ. EMA/MA $2,175–$2,200 ශ්රේෂ්ඨ. $2,000 ශ්රේෂ්ඨ; ශ්රේෂ්ඨ $1,950 සහ $1,850. CLARITY Act, PCE, BTC. ශ්රේෂ්ඨ: $2,000–$2,200.
නිගමනය
මැයි 25–29 ගනුදෙනු සතිය ශ්රේෂ්ඨ ශ්රේෂ්ඨ ශ්රේෂ්ඨ. සඳුදා Memorial Day ශ්රේෂ්ඨ ශ්රේෂ්ඨ ශ්රේෂ්ඨ. බ්රහස්පතින්දා–සිකුරාදා Q1 GDP ශ්රේෂ්ඨ PCE Fed ශ්රේෂ්ඨ.
EUR/USD 200-දින SMA (~1.1615) ශ්රේෂ්ඨ; PCE 1.1483. බ්රෙන්ට් $103–$104: Hormuz $15–20 ශ්රේෂ්ඨ; $112+. රන් $4,600 100-දින SMA ශ්රේෂ්ඨ – PCE $4,400 ශ්රේෂ්ඨ $4,580. රිදී 20-EMA ($77.79) ශ්රේෂ්ඨ $70. බිට්කොයින් $74,500 ශ්රේෂ්ඨ 200-EMA ($82,228). ඉතීරියම් BTC ශ්රේෂ්ඨ $2,175–$2,200 ශ්රේෂ්ඨ $2,000.
NordFX Analytical Group
වියාකරණ සටහන: මෙම ද්රව්ය ආයෝජන නිර්දේශයක් හෝ මූල්ය වෙළඳපොළ හිදී ක්රියාකිරීම සඳහා මාර්ගෝපදේශයක් නොවේ; ඒවා ශ්රේෂ්ඨ ශ්රේෂ්ඨ ශ්රේෂ්ඨ. මූල්ය වෙළඳපොළ ශ්රේෂ්ඨ ශ්රේෂ්ඨ ශ්රේෂ්ඨ.
ආපසු යන්න ආපසු යන්න
