First, a review of last week’s forecast: thanks to this forecast, traders who took into account the main recommendations of experts and technical analysis, could receive a significant profit. So:
- EUR/USD. The basic forecast, which was sounded by the majority of experts (60%) with the support of technical analysis, spoke about the growth of this pair. And it did go north, starting from Monday. Although at first this movement was not very strong and confident, on Friday, August 25, the pair shot up sharply, reaching the height of 1.1940, supported by the speech of the Federal Reserve Head, Janet Yellen, it finished the week at the height of 1.1921 - near the central level of resistance, indicated by analysts;
- Speaking about the behavior of the pair GBP/USD, the majority of experts, supported by the absolute majority of indicators (80%), as well as graphical analysis on D1, voted for its fall to the level of 1.2760. After that, the pair should have changed the trend to an ascending one. This forecast came true by all 100%. By Thursday, the pair had fallen to the level of 1.2772, then it turned and on Friday returned to the values of the beginning of the week;
- As for the USD/JPY, it was expected that the pair would stay in the sideways trend for a while, making fluctuations in the range of 108.80-110.30. With a slight adjustment, this forecast can also be considered absolutely true - the pair spent the whole week moving to the east in the channel 108.63-109.82;
- The analysts didn't make mistakes predicting the behavior of the pair USD/CHF either. Its fall to the level of 0.9500 was expected by 60% of experts and the overwhelming majority (about 85%) of trend indicators and oscillators. As a result, the local bottom was fixed at 0.9550. And although this horizon was 50 points higher than expected, all those traders who took into account this forecast benefited for sure, as the pair's fall for the week was about 100 points.
As for the forecast for the coming week, summarizing the opinions of analysts from a number of banks and broker companies, as well as forecasts made on the basis of a variety of methods of technical and graphical analysis, we can say the following:
- EUR/USD. Although a quarter of the oscillators on H4 and D1 are already signaling that the pair is overbought, the bulk of them, supported by 100% of trend indicators and 40% of experts, still insists on continuation of the uptrend. The nearest target in this case is 1.2040, the next one is 100 points higher. As for the bears' supporters, who are the majority among the analysts (60%), they, just like the graphical analysis on D1, expect a correction of the pair. The main support is 1.1780, the next one is 1.1740, and in case of a breakdown, it is 1.1680;
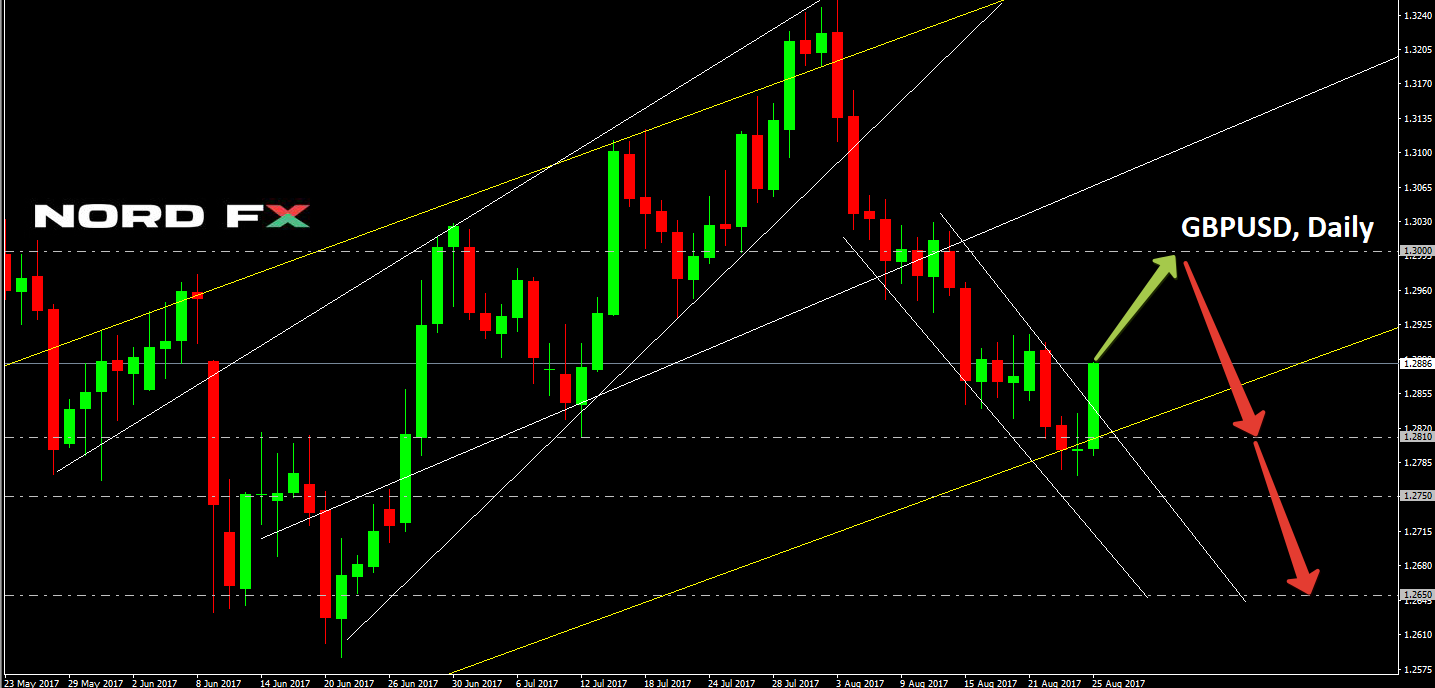
- Speaking of the future of the GBP/USD, about 35% of analysts are determined to buy this pair, 45% are for sale and 20% remain neutral. A similar discord is observed in the indicators as well. Out of the trend ones on H4, 70% are looking to the north, 30% to the south; on D1, the situation is exactly the opposite. Oscillators show the same picture: on H4, 75% are colored green, 25% indicate the pair is overbought, and on D1 90% of the indicators are colored red.
In such a situation, it makes sense to pay attention to the graphical analysis. Both on H4 and D1, its forecasts converge and speak first about the growth of the pair to the area of 1.3000, and then about the reversal of the trend and the fall of the pair first to the level of 1.2810, and in case of a breakdown, to support 1.2750 or another 100 points lower;

- As for USD/JPY, most analysts (70%) still expect the pair to fall to the April 2017 low (108.12). Approximately 90% of the indicators agree with this scenario. The resistance levels are 109.85, 110.60 and 111.00, the support zone is 108.60-108.75;
- The last pair of our review is USD/CHF. It is clear that most of the indicators here look to the south, but already about 20% of the oscillators on H4 and D1 signal that this pair is oversold. 70% of experts and graphical analysis on D1 also speak about its possible growth. The targets are 0.9615, 0.9700 and 0.9765. The support levels are 1.1685, 1.1600 and 1.1475.
And in conclusion, here are some words about the major events that can seriously affect the indications of technical analysis. Thus, on Wednesday August 30, data on inflation in the UK and the US GDP will be released. Thursday will bring news on unemployment in Germany and the state of the consumer market of the Eurozone, in general. As for September 1, as it happens on the first Friday of each month, the market is expecting the US unemployment data.
Roman Butko, NordFX
Go Back Go Back
