How do I set up a chart in MT5 for Windows?
Short answer: Open a chart by right-clicking an instrument in Market Watch and selecting Chart Window. Choose a chart type and timeframe, then open Properties to adjust its appearance. Use Zoom In, Zoom Out, Auto Scroll, and Chart Shift to control how you view price movements.
Open a chart for your instrument
In Market Watch, right-click the instrument you want to view and select Chart Window. Alternatively, use File → New Chart and choose an instrument.
A chart should appear in the workspace. Check its symbol before continuing, especially if several charts are open.
To open another chart, repeat the same process. This also lets you view the same instrument in separate windows.
Avoid dragging an instrument onto an existing chart unless you want to replace that chart’s symbol: MT5 reuses the window and applies its existing settings to the new instrument.
Choose a chart type and timeframe
Switch between candlesticks, bars, and a line
Click inside the chart you want to change, then open the Charts menu and select its display type.
Candlesticks and bars show the opening, highest, lowest, and closing prices for each period. A line chart connects closing prices and provides a simpler view.
For this walkthrough, select Candlesticks. The active chart should immediately change to candles. You can switch back at any time without opening another chart.
Set the timeframe
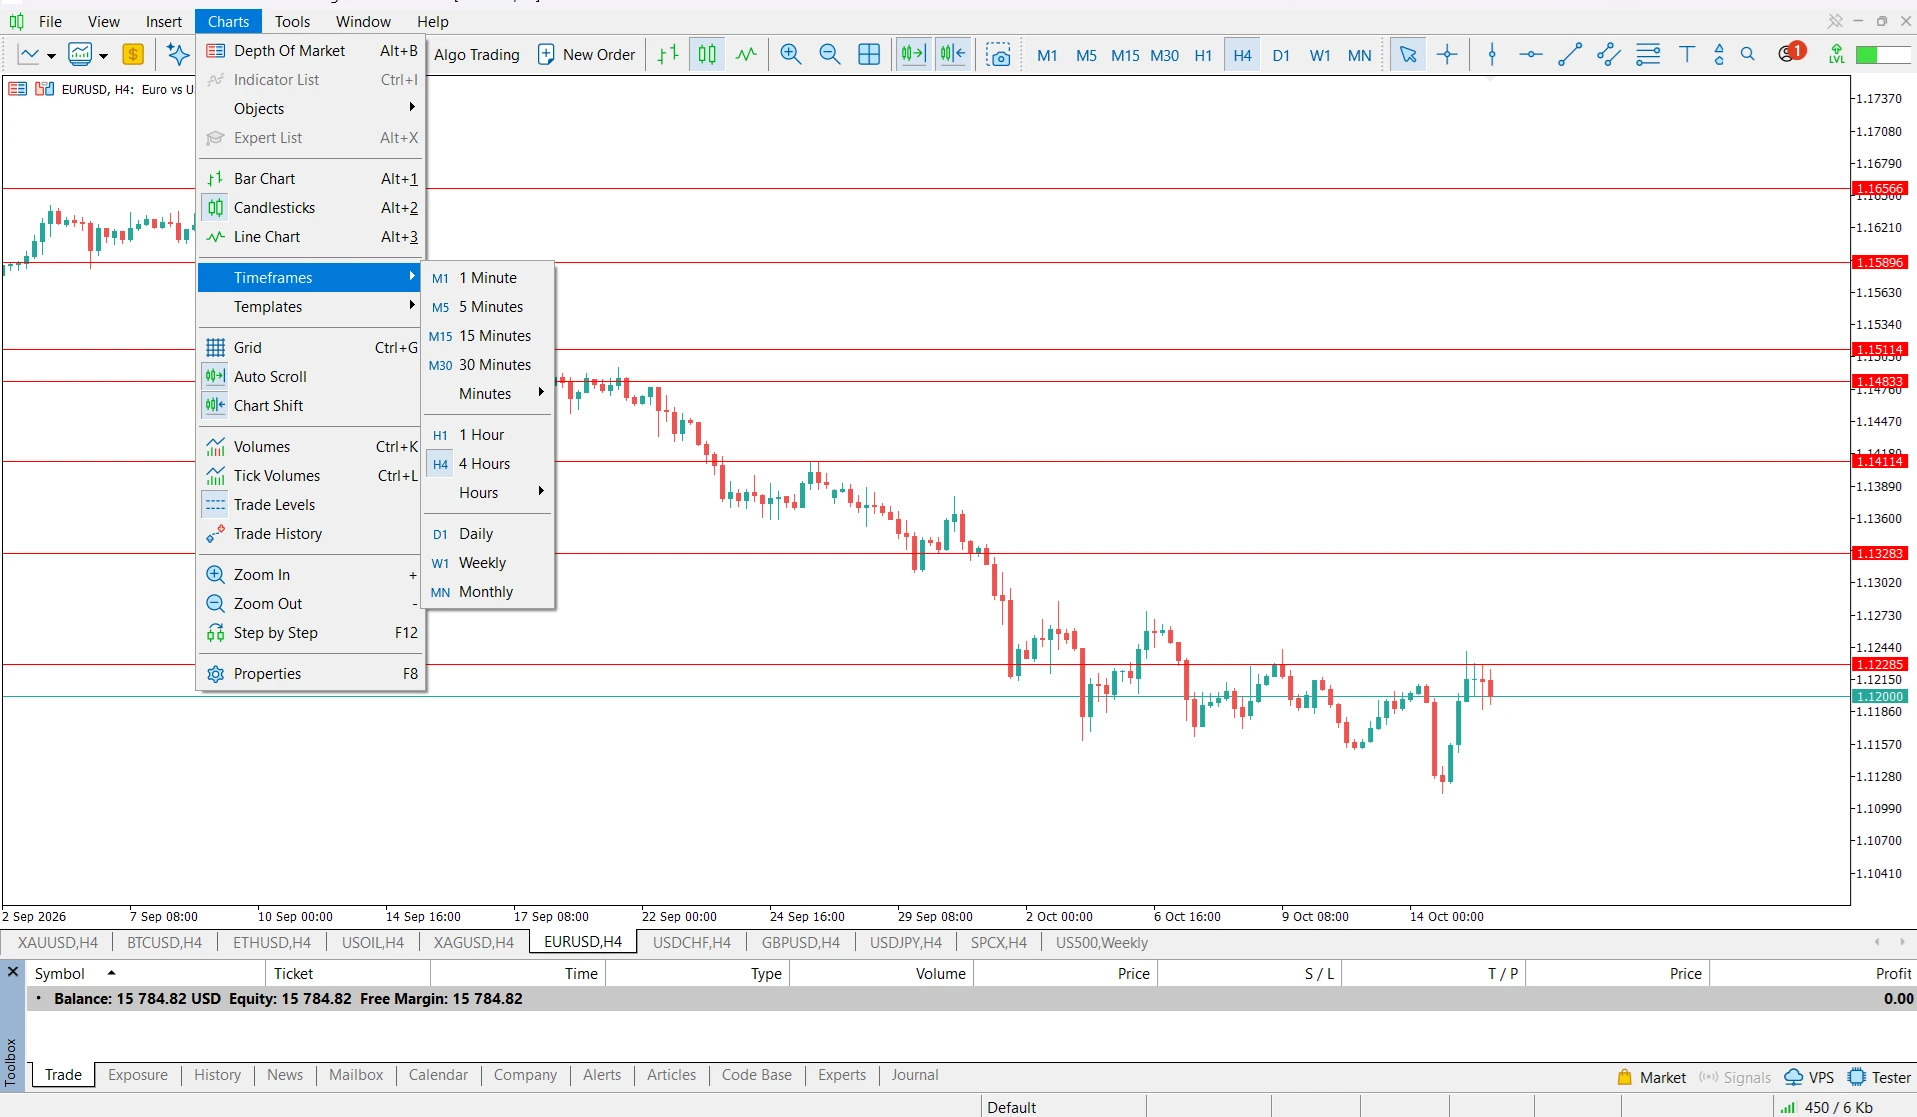
Right-click the chart, open Timeframes, and select an interval. For example, M15 represents 15 minutes per candle, H1 represents one hour, and D1 represents one day.
Select H1 for a practice setup. Check that H1 appears alongside the chart’s symbol. Changing the timeframe changes the period represented by each candle; zooming changes only how large those candles appear.
MT5 desktop offers 21 timeframes, from one minute to one month.
Your eventual choice should match the analysis you want to perform. NordFX’s guide to choosing a timeframe for intraday trading explains how shorter and longer intervals provide different perspectives.
Change chart colors and remove the grid
Right-click the chart and select Properties.
Adjust background and candle colors
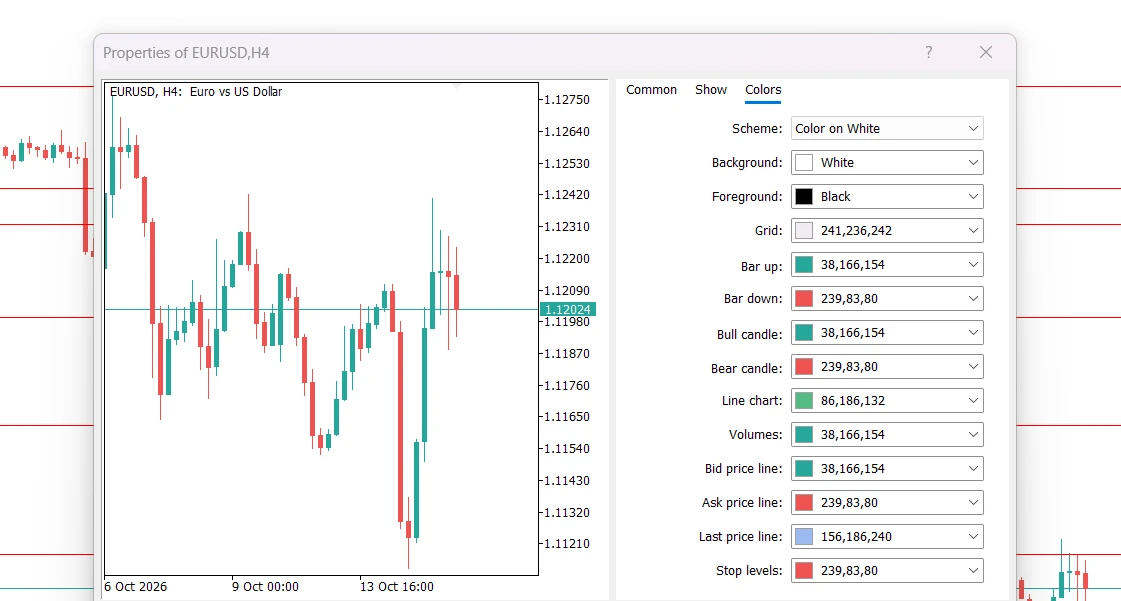
Open the Colors tab. Choose a preset from Scheme or change individual elements.
For a simple white-background chart, set Background to white and Text to black. Set Bar up and Bull candle to green, then Bar down and Bear candle to red. Bar colors control candle outlines and wicks; Bull candle and Bear candle control the bodies.
Use the preview to check visibility, then click OK.
Show or hide the grid
Open Properties again and select the Show tab. Clear Show grid, then click OK. Re-enable it if you prefer reference lines behind the candles.
Adjust zoom and price scale
Make candles larger or smaller
Activate the chart and choose Charts → Zoom In or Charts → Zoom Out. Zooming in makes candles wider; zooming out shows more history.
Adjust the vertical scale
Click and drag the price scale on the right to compress or expand the chart vertically. Double-click the price scale to restore its scale.
If it remains constrained, open Properties → Common, check whether Scale fix is enabled, and disable it if you want automatic vertical scaling.
Control scrolling and space beside the latest candle
Use Auto Scroll for current prices
Enable Charts → Auto Scroll to keep the chart at the latest prices as quotes arrive.
Disable it before reviewing older candles, then drag horizontally inside the chart to move through history. Otherwise, incoming quotes can bring you back to the latest bar.
Use Chart Shift for extra space
Enable Charts → Chart Shift to leave space between the latest candle and the right edge. Drag the small triangle at the top of the chart horizontally to adjust that gap.
Add indicators and reuse your setup
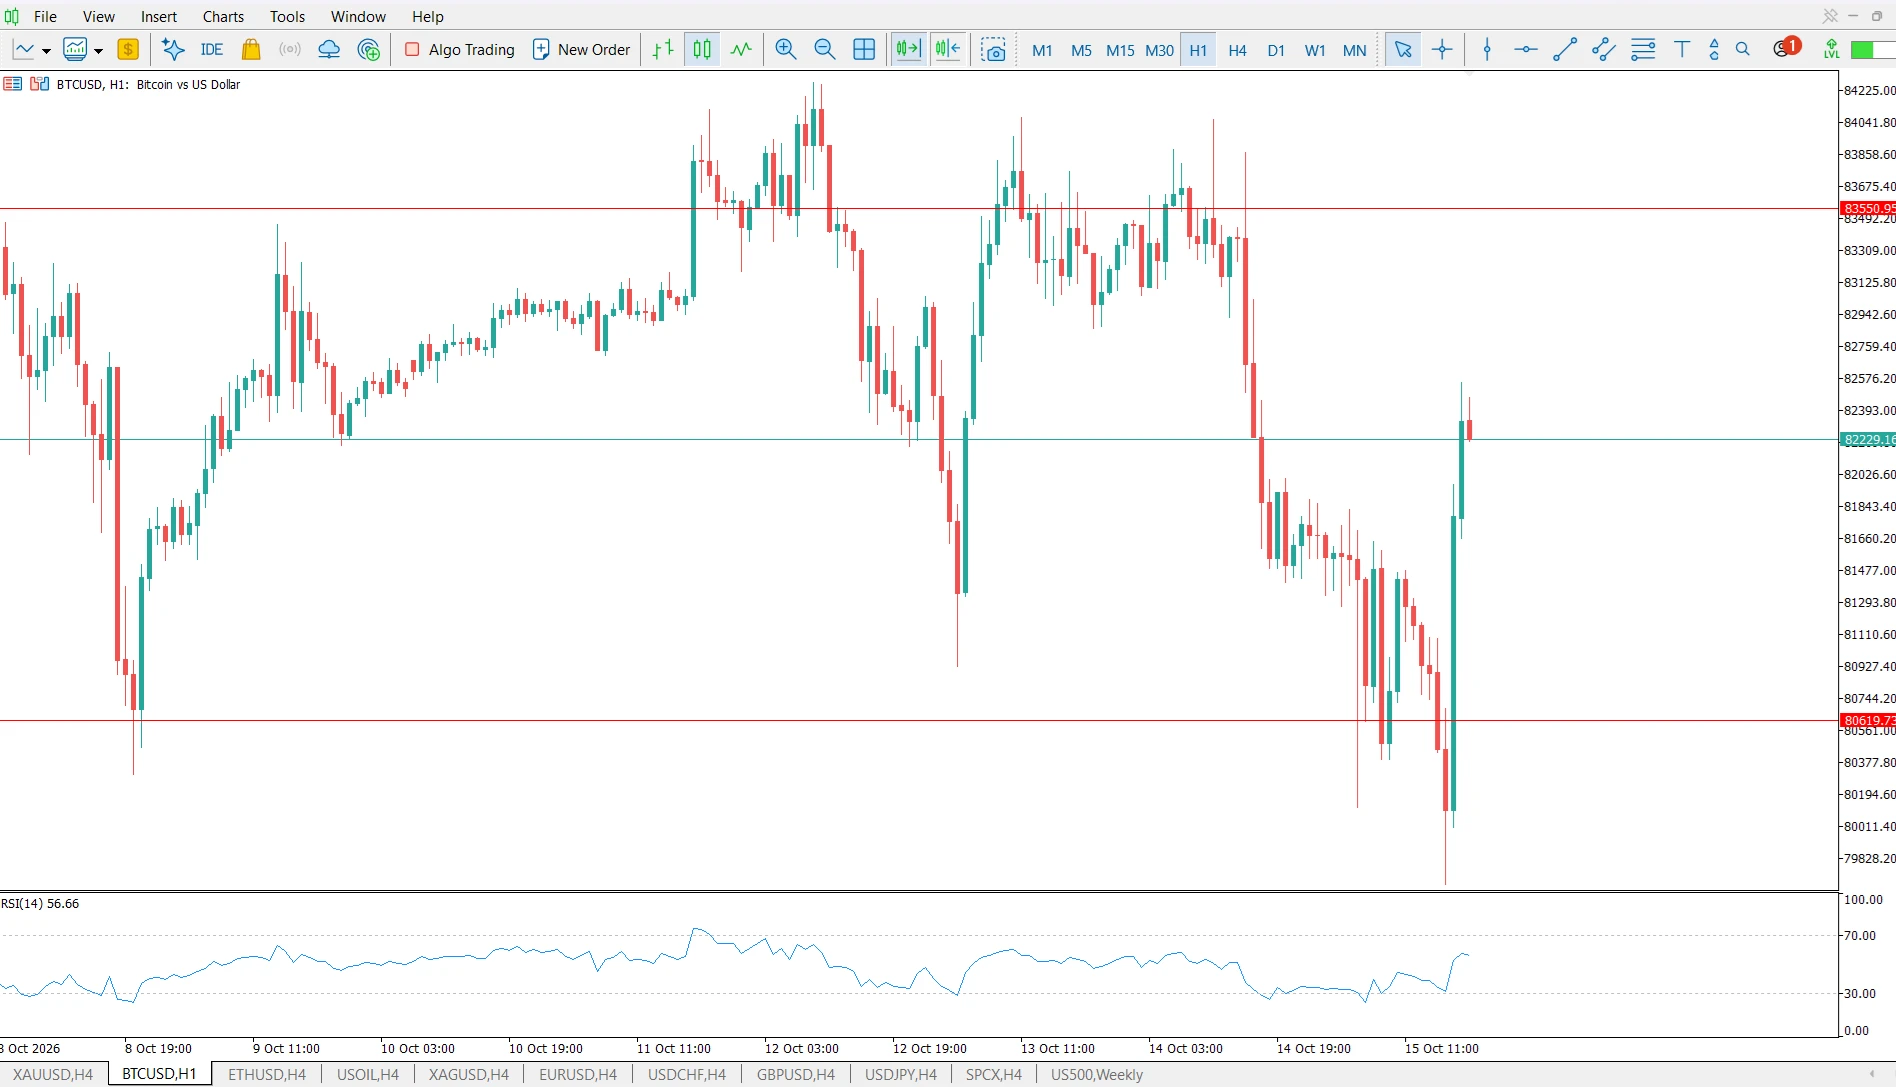
Once the chart is comfortable to read, you can add an indicator through Insert → Indicators. Select an indicator, review its parameters, and click OK. NordFX’s tutorial on adding indicators in MT5 covers this separately.
To reuse your appearance settings, right-click the finished chart and choose Templates → Save Template. Enter a descriptive name, such as Clean_Chart, and save it.
For instructions on applying that setup elsewhere or organizing several charts, see how to use templates and profiles in MT5.
Frequently Asked Questions
Why does my chart keep jumping back to the latest candle?
Auto Scroll is probably enabled. Turn it off through the Charts menu while reviewing historical prices.
Why did only the candle bodies change color?
The bodies and outlines have separate settings. In Properties → Colors, adjust Bar up and Bar down as well as Bull candle and Bear candle.
Can I view the same instrument on two different timeframes?
Yes. Open another Chart Window for that instrument, then select a different timeframe in each window. For example, keep one on H1 and another on M15.
How do I make new charts use my preferred appearance?
Save your configured chart as a template named default.tpl. MT5 applies that template when creating new charts. This replaces the previous default appearance, so save a separately named copy first if you want to keep it.
Go Back Go Back